

Part B: Use the Simmons data set in module 10. See the Excel file titled Simmons-data-raw...
Fantastic news! We've Found the answer you've been seeking!
Question:
Transcribed Image Text:
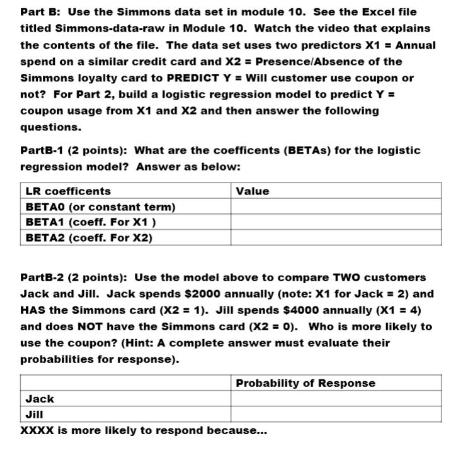
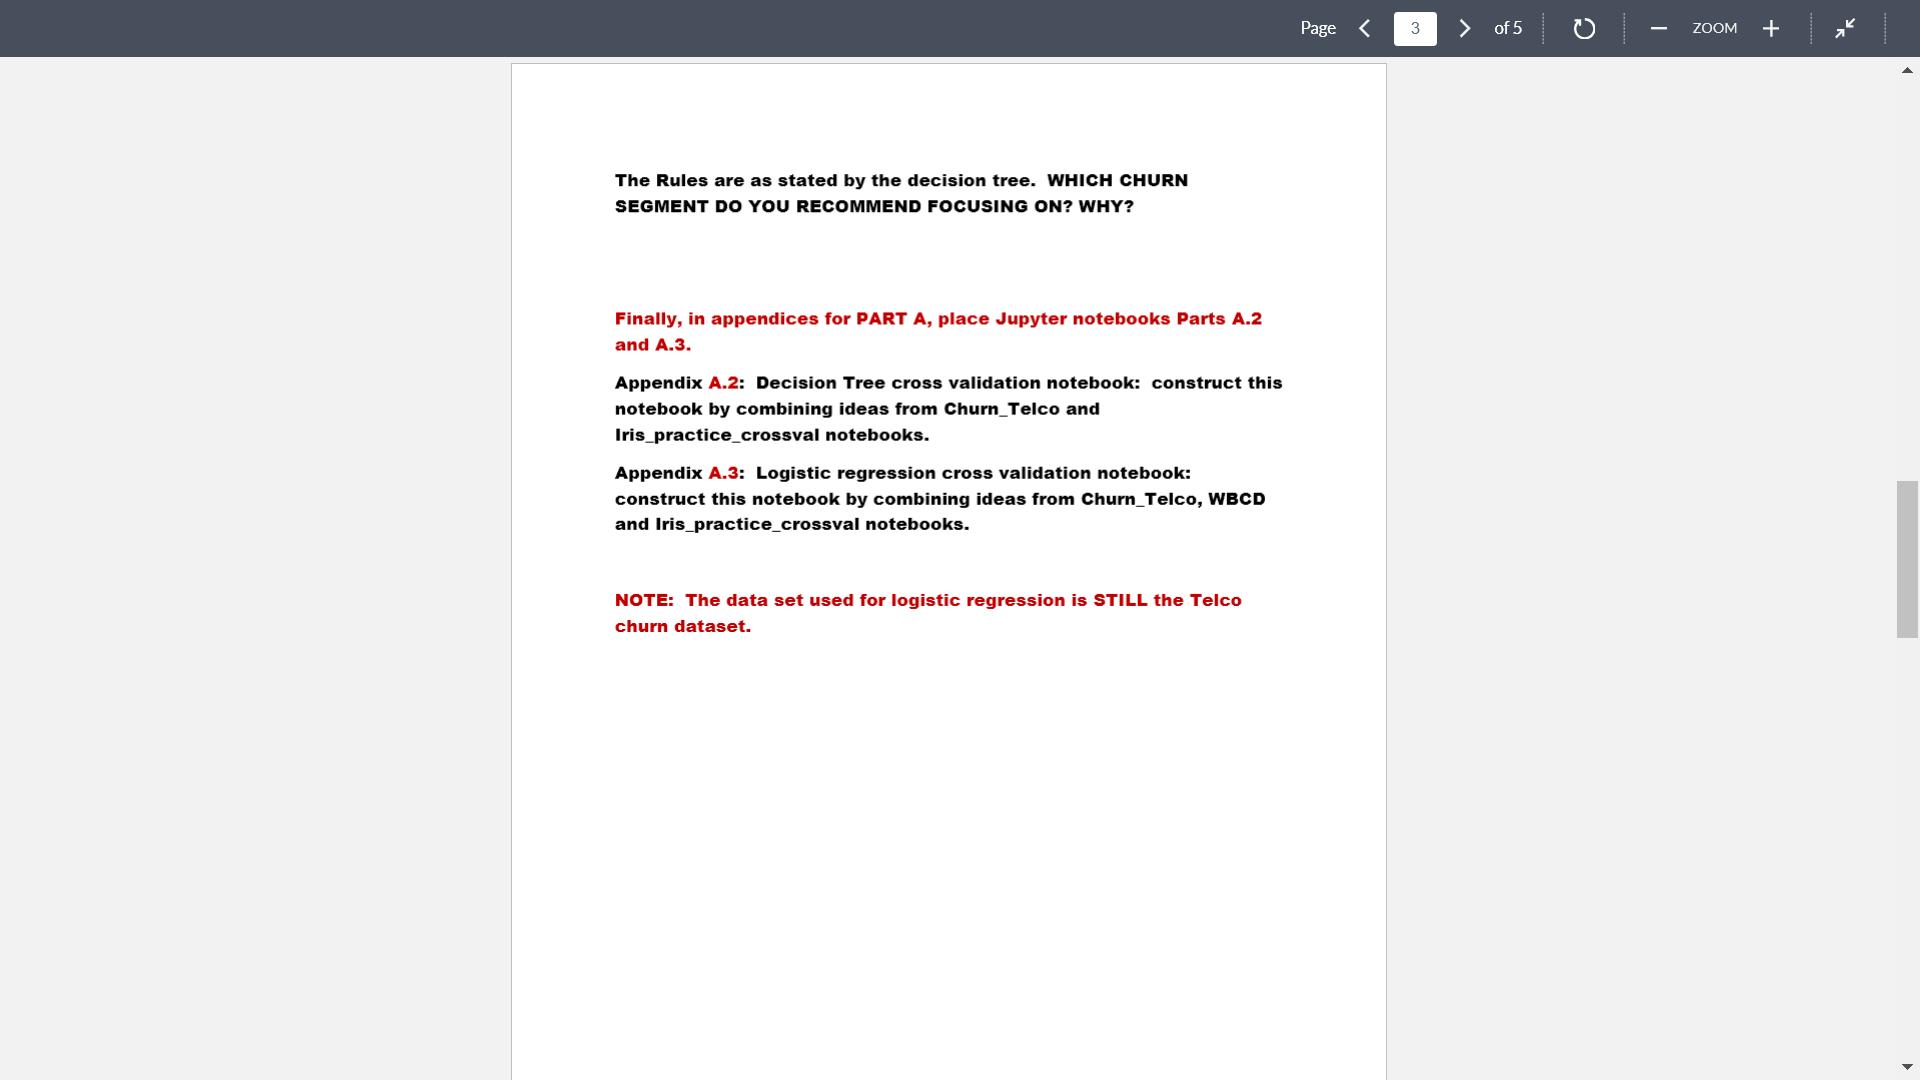
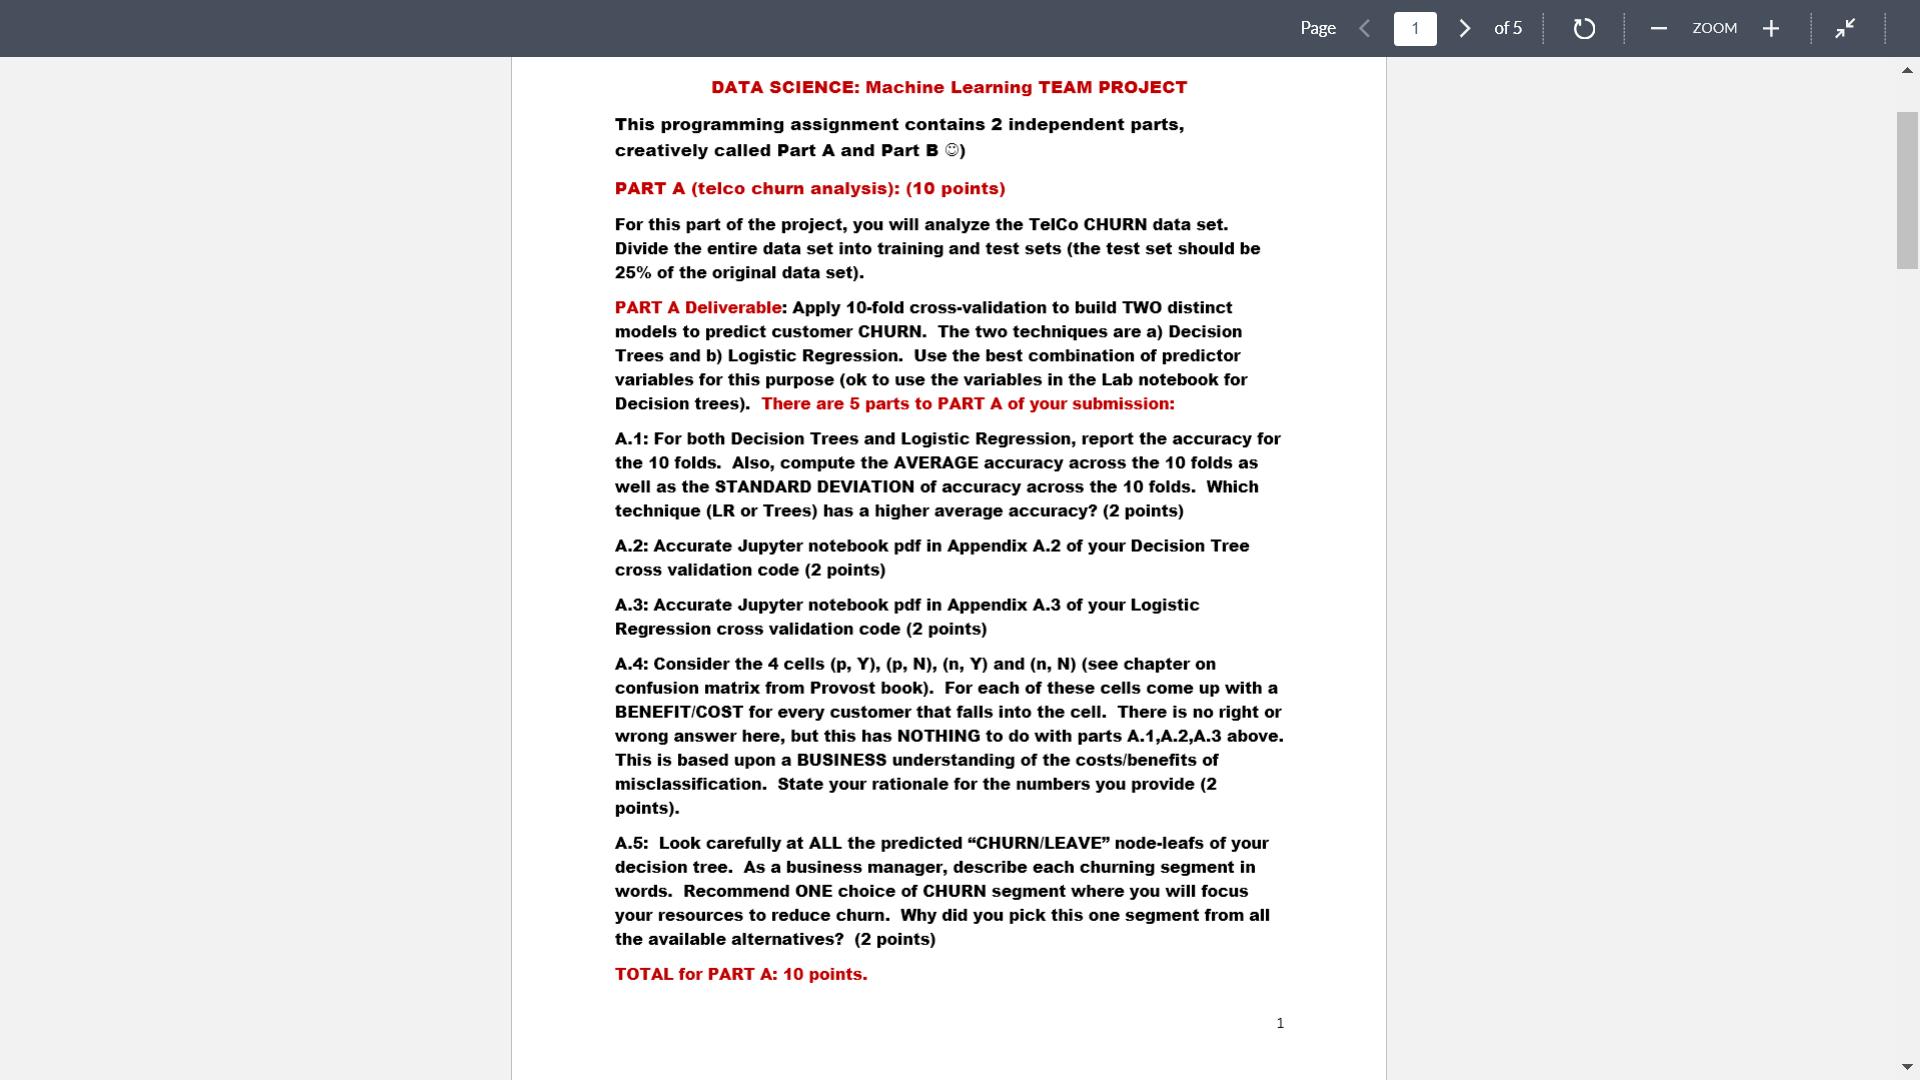
Part B: Use the Simmons data set in module 10. See the Excel file titled Simmons-data-raw in Module 10. Watch the video that explains the contents of the file. The data set uses two predictors X1 = Annual spend on a similar credit card and X2 = Presence/Absence of the Simmons loyalty card to PREDICT Y = Will customer use coupon or not? For Part 2, build a logistic regression model to predict Y = coupon usage from X1 and X2 and then answer the following questions. PartB-1 (2 points): What are the coefficents (BETAs) for the logistic regression model? Answer as below: LR coefficents BETAO (or constant term) BETA1 (coeff. For X1) BETA2 (coeff. For X2) Value PartB-2 (2 points): Use the model above to compare TWO customers Jack and Jill. Jack spends $2000 annually (note: X1 for Jack = 2) and HAS the Simmons card (X2 = 1). Jill spends $4000 annually (X1 = 4) and does NOT have the Simmons card (X2 = 0). Who is more likely to use the coupon? (Hint: A complete answer must evaluate their probabilities for response). Probability of Response Jack Jill XXXX is more likely to respond because... PartB-3 (1 point): If you were to ROLL OUT the logistic regression model to PREDICT coupon usage for a LARGE database of customers, what CUTOFF probability will you choose? (Hint: No right or wrong answer here, but a concept such as a CONFUSION MATRIX may help make your call for cutoff probability). The Rules are as stated by the decision tree. WHICH CHURN SEGMENT DO YOU RECOMMEND FOCUSING ON? WHY? Finally, in appendices for PART A, place Jupyter notebooks Parts A.2 and A.3. Appendix A.2: Decision Tree cross validation notebook: construct this notebook by combining ideas from Churn_Telco and Iris practice_crossval notebooks. Appendix A.3: Logistic regression cross validation notebook: construct this notebook by combining ideas from Churn_Telco, WBCD and Iris_practice_crossval notebooks. NOTE: The data set used for logistic regression is STILL the Telco churn dataset. Page < 3 of 5 C | ZOOM + Hints for writing a good report for Part A: The report for PART A does not have to be long (no more than 5 pages), but should be super-clear. Imagine you are presenting the report to senior management. Here are some suggestions: Part A.1: Describe the numbers below in a table: Decision Tree Cross-validation Fold Fold 1 Fold 2 Fold 3 Fold 4 Fold 5 Fold 6 Fold 7 Fold 8 Fold 9 Fold 10 Average Error % Std. Dev. Error % See IRIS PRACTICE CROSSVAL Jupyter notebook in Module 6 for how to create a 10-fold cross-validation (that notebook shows you a 5-fold). Next place Part A.4 (not parts A.2, A.3): Y N Logistic Regression Р $ Benefit $ cost Churn segment 1... Churn segment 2... n $ cost $ benefit Write a few sentences supporting the $benefit/cost numbers. How did you come up with these numbers? Next place Part A.5 (not parts A.2, A.3): RULES for identifying Description in words Page 2 of 5 C | ZOOM + DATA SCIENCE: Machine Learning TEAM PROJECT This programming assignment contains 2 independent parts, creatively called Part A and Part B Ⓒ) PART A (telco churn analysis): (10 points) For this part of the project, you will analyze the TelCo CHURN data set. Divide the entire data set into training and test sets (the test set should be 25% of the original data set). PART A Deliverable: Apply 10-fold cross-validation to build TWO distinct models to predict customer CHURN. The two techniques are a) Decision Trees and b) Logistic Regression. Use the best combination of predictor variables for this purpose (ok to use the variables in the Lab notebook for Decision trees). There are 5 parts to PART A of your submission: A.1: For both Decision Trees and Logistic Regression, report the accuracy for the 10 fold Also, compute the VERAGE accuracy across folds as well as the STANDARD DEVIATION of accuracy across the 10 folds. Which technique (LR or Trees) has a higher average accuracy? (2 points) A.2: Accurate Jupyter notebook pdf in Appendix A.2 of your Decision Tree cross validation code (2 points) A.3: Accurate Jupyter notebook pdf in Appendix A.3 of your Logistic Regression cross validation code (2 points) A.4: Consider the 4 cells (p, Y), (p, N), (n, Y) and (n, N) (see chapter on confusion matrix from Provost book). For each of these cells come up with a BENEFIT/COST for every customer that falls into the cell. There is no right or wrong answer here, but this has NOTHING to do with parts A.1,A.2,A.3 above. This is based upon a BUSINESS understanding of the costs/benefits of misclassification. State your rationale for the numbers you provide (2 points). A.5: Look carefully at ALL the predicted "CHURN/LEAVE" node-leafs of your decision tree. As a business manager, describe each churning segment in words. Recommend ONE choice of CHURN segment where you will focus your resources to reduce churn. Why did you pick this one segment from all the available alternatives? (2 points) TOTAL for PART A: 10 points. 1 Page 1 of 5 C | ZOOM + Part B: Use the Simmons data set in module 10. See the Excel file titled Simmons-data-raw in Module 10. Watch the video that explains the contents of the file. The data set uses two predictors X1 = Annual spend on a similar credit card and X2 = Presence/Absence of the Simmons loyalty card to PREDICT Y = Will customer use coupon or not? For Part 2, build a logistic regression model to predict Y = coupon usage from X1 and X2 and then answer the following questions. PartB-1 (2 points): What are the coefficents (BETAs) for the logistic regression model? Answer as below: LR coefficents BETAO (or constant term) BETA1 (coeff. For X1) BETA2 (coeff. For X2) Value PartB-2 (2 points): Use the model above to compare TWO customers Jack and Jill. Jack spends $2000 annually (note: X1 for Jack = 2) and HAS the Simmons card (X2 = 1). Jill spends $4000 annually (X1 = 4) and does NOT have the Simmons card (X2 = 0). Who is more likely to use the coupon? (Hint: A complete answer must evaluate their probabilities for response). Probability of Response Jack Jill XXXX is more likely to respond because... PartB-3 (1 point): If you were to ROLL OUT the logistic regression model to PREDICT coupon usage for a LARGE database of customers, what CUTOFF probability will you choose? (Hint: No right or wrong answer here, but a concept such as a CONFUSION MATRIX may help make your call for cutoff probability). The Rules are as stated by the decision tree. WHICH CHURN SEGMENT DO YOU RECOMMEND FOCUSING ON? WHY? Finally, in appendices for PART A, place Jupyter notebooks Parts A.2 and A.3. Appendix A.2: Decision Tree cross validation notebook: construct this notebook by combining ideas from Churn_Telco and Iris practice_crossval notebooks. Appendix A.3: Logistic regression cross validation notebook: construct this notebook by combining ideas from Churn_Telco, WBCD and Iris_practice_crossval notebooks. NOTE: The data set used for logistic regression is STILL the Telco churn dataset. Page < 3 of 5 C | ZOOM + Hints for writing a good report for Part A: The report for PART A does not have to be long (no more than 5 pages), but should be super-clear. Imagine you are presenting the report to senior management. Here are some suggestions: Part A.1: Describe the numbers below in a table: Decision Tree Cross-validation Fold Fold 1 Fold 2 Fold 3 Fold 4 Fold 5 Fold 6 Fold 7 Fold 8 Fold 9 Fold 10 Average Error % Std. Dev. Error % See IRIS PRACTICE CROSSVAL Jupyter notebook in Module 6 for how to create a 10-fold cross-validation (that notebook shows you a 5-fold). Next place Part A.4 (not parts A.2, A.3): Y N Logistic Regression Р $ Benefit $ cost Churn segment 1... Churn segment 2... n $ cost $ benefit Write a few sentences supporting the $benefit/cost numbers. How did you come up with these numbers? Next place Part A.5 (not parts A.2, A.3): RULES for identifying Description in words Page 2 of 5 C | ZOOM + DATA SCIENCE: Machine Learning TEAM PROJECT This programming assignment contains 2 independent parts, creatively called Part A and Part B Ⓒ) PART A (telco churn analysis): (10 points) For this part of the project, you will analyze the TelCo CHURN data set. Divide the entire data set into training and test sets (the test set should be 25% of the original data set). PART A Deliverable: Apply 10-fold cross-validation to build TWO distinct models to predict customer CHURN. The two techniques are a) Decision Trees and b) Logistic Regression. Use the best combination of predictor variables for this purpose (ok to use the variables in the Lab notebook for Decision trees). There are 5 parts to PART A of your submission: A.1: For both Decision Trees and Logistic Regression, report the accuracy for the 10 fold Also, compute the VERAGE accuracy across folds as well as the STANDARD DEVIATION of accuracy across the 10 folds. Which technique (LR or Trees) has a higher average accuracy? (2 points) A.2: Accurate Jupyter notebook pdf in Appendix A.2 of your Decision Tree cross validation code (2 points) A.3: Accurate Jupyter notebook pdf in Appendix A.3 of your Logistic Regression cross validation code (2 points) A.4: Consider the 4 cells (p, Y), (p, N), (n, Y) and (n, N) (see chapter on confusion matrix from Provost book). For each of these cells come up with a BENEFIT/COST for every customer that falls into the cell. There is no right or wrong answer here, but this has NOTHING to do with parts A.1,A.2,A.3 above. This is based upon a BUSINESS understanding of the costs/benefits of misclassification. State your rationale for the numbers you provide (2 points). A.5: Look carefully at ALL the predicted "CHURN/LEAVE" node-leafs of your decision tree. As a business manager, describe each churning segment in words. Recommend ONE choice of CHURN segment where you will focus your resources to reduce churn. Why did you pick this one segment from all the available alternatives? (2 points) TOTAL for PART A: 10 points. 1 Page 1 of 5 C | ZOOM +
Expert Answer:
Answer rating: 100% (QA)
R Code The following R code should produce the same results data1Y... View the full answer

Related Book For 

Income Tax Fundamentals 2013
ISBN: 9781285586618
31st Edition
Authors: Gerald E. Whittenburg, Martha Altus Buller, Steven L Gill
Posted Date:
Students also viewed these databases questions
-
Superior Company provided the following data for the year ended December 31 (all raw materials are used in production as direct materials): Selling expenses Purchases of raw materials Direct labor...
-
Planning is one of the most important management functions in any business. A front office managers first step in planning should involve determine the departments goals. Planning also includes...
-
Answer the following questions: 1. Build the management-research question hierarchy for Starbuck project 2. the Duetto Card team turned to Green field Online to recruit a panel for one of its online...
-
Under Social Security, the family of a worker who dies while fully insured at the time of death has a right to survivors' benefits. True False
-
1. How might presenteeism be an adaptive response to perceived performance pressure? How is it a response to work demand pressures? 2. How might a company work to change employee attitudes and...
-
On January 1, 2012, Fleming Corporation issued $2,400,000 of 5-year, 7% bonds at 96; the bonds pay interest semiannually on July 1 and January 1. By January 1, 2014, the market rate of interest for...
-
The stress-strain diagram for a material can be approximated by the two line segments. If a bar having a diameter of \(80 \mathrm{~mm}\) and length of \(1.5 \mathrm{~m}\) is made from this material,...
-
Transfer pricing, utilization of capacity. (J. Patell, adapted) The California Instrument Company (CIC) consists of the semiconductor division and the process-control division, each of which operates...
-
The propositions p, q, r, and s are defined by p: Alice is a mathematician. q: Alice loves to solve puzzles. r: Alice has won a math competition. s: Alice enjoys teaching math. (a) Using the...
-
Pacifico Company, a U.S.-based Importer of beer and wine, purchased 1,500 cases of Oktoberfest-style beer from a German supplier for 375,000 euros. Relevant U.S. dollar exchange rates for the euro...
-
Assume that a person lacks the mental capacity to enter into a contract, but appears to strangers to be normal, as in many cases of dementia and other mental illnesses. If that person enters into a...
-
What processes can help ensure that product teams adopt best-in-class value-based pricing and offer design for their digital solutions?
-
How do you get customer insights to develop packaging models?
-
What is important in platforms and marketplaces to capturing value?
-
How can the customer value from a smart-product-service offering be evaluated?
-
How can companies include these research techniques in their digital innovation development process?
-
A disk of mass M = 14 kg and radius 1 m is attached to a spring which has a stiffness k 75 N/m and an upstretched length of 1 m. If the disk is released from rest in the position shown in the figure...
-
The Smiths buy a house. They borrow 80 percent of the purchase price from the local ABC Savings and Loan. Before they make their first payment, ABC transfers the right to receive mortgage payments to...
-
Jenny earns $34,500 in 2012. Calculate the FICA tax that must be paid by: Jenny: ..............................Soc,Sec. ..................$______________...
-
Deborah purchases a new $30,000 car in 2012 to use exclusively in her business. If Deborah does not elect to expense or take bonus depreciation in 2012 and holds the car until it is fully...
-
If Charles, a 16-year-old child model, earns $50,000 a year and is completely self supporting even though he lives with his parents, can his parents claim him as a dependent? Why or why not?...
-
A data set contains only two values. Are the mean, median, and midrange all equal? Explain.
-
Consider the following data set: a. Show that the mean and median are both equal to 5. b. Suppose that a value of 26 is added to this data set. Which is affected more, the mean or the median? c....
-
Consider the following data set: a. Compute the mean and median. b. Based on the mean and median, would you expect the data set to be skewed to the left, skewed to the right, or approximately...

Study smarter with the SolutionInn App