

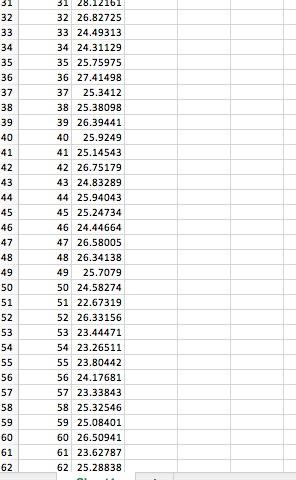
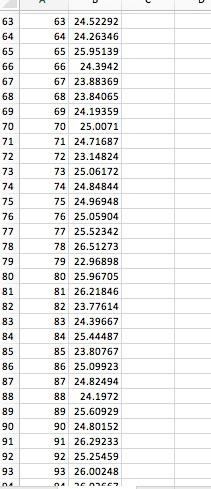
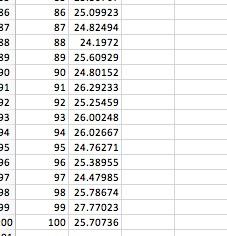
The Excel file sample contains 100 observations, X, drawn from a distribution that is n(,1). Use Excel
Fantastic news! We've Found the answer you've been seeking!
Question:
The Excel file sample contains 100 observations, X, drawn from a distribution that is n(μ,1). Use Excel and your own computations to calculate:
• P(24.9 ≤ μ ≤ 25.1) based only on observations 1 through 50; and
• P(24.9 ≤ μ ≤ 25.1) based on all 100 observations.
You can use Excel to compute the sample means based on the above three samples.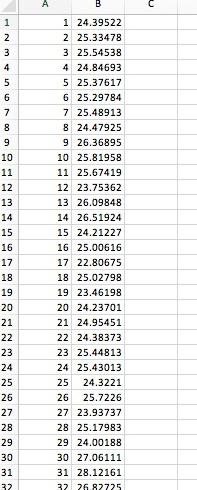
Expert Answer:

Related Book For 
Posted Date:
