

The following chart shows the selling price, in thousands of dollars, of houses sold last month in
Fantastic news! We've Found the answer you've been seeking!
Question:
The following chart shows the selling price, in thousands of dollars, of houses sold last month in Corner Brook, Newfoundland:
a. How many homes were studied?
b. What is the class interval?
c. One hundred homes sold for less than what amount? $ approximately.
d. About 25% of the homes sold for less than what amount? $ approximately.
e. Estimate the number of homes in the $150000 up to $200000 class.
f. About how many homes sold for less than $225000?n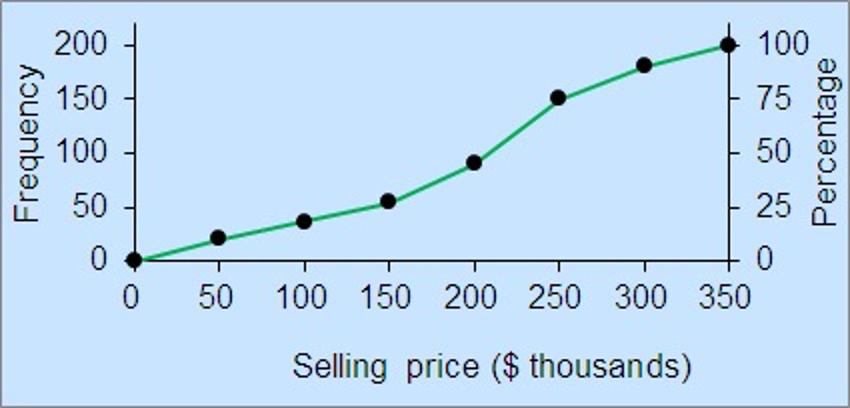
Expert Answer:

Related Book For 
Basic Statistics for Business and Economics
ISBN: 978-0073521473
8th edition
Authors: Douglas Lind, William Marchal, Samuel Wathen
Posted Date:
