

The following graph shows the market for cars in 2009. Between 2009 and 2010, the equilibrium quantity
Fantastic news! We've Found the answer you've been seeking!
Question:
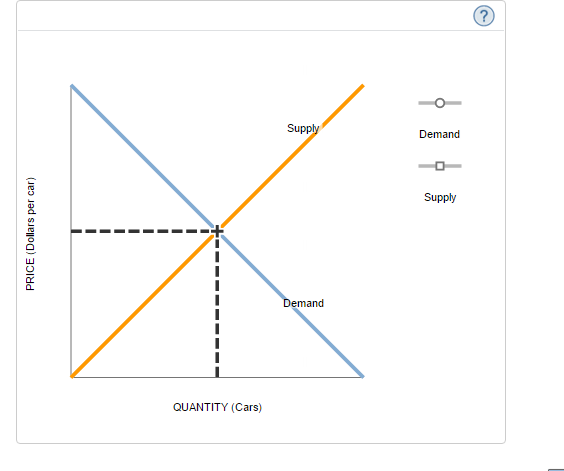
The following graph shows the market for cars in 2009. Between 2009 and 2010, the equilibrium quantity of cars remained constant, but the equilibrium price of cars decreased. From this, you can conclude that between 2009 and 2010, the supply of cars (decreased, increased, unchanged) and the demand for cars (decreased, increased, unchanged).
Adjust the graph to illustrate your answer by showing the positions of the supply and demand curves in 2010.
Expert Answer:
For 2009 equilibrium quantity to remain unchanged yet priced reduced supply would have increased and ... View the full answer

Related Book For 

Posted Date:
