

The following table shows some information on a variety of different vehicles. Using the information given...
Fantastic news! We've Found the answer you've been seeking!
Question:
Transcribed Image Text:
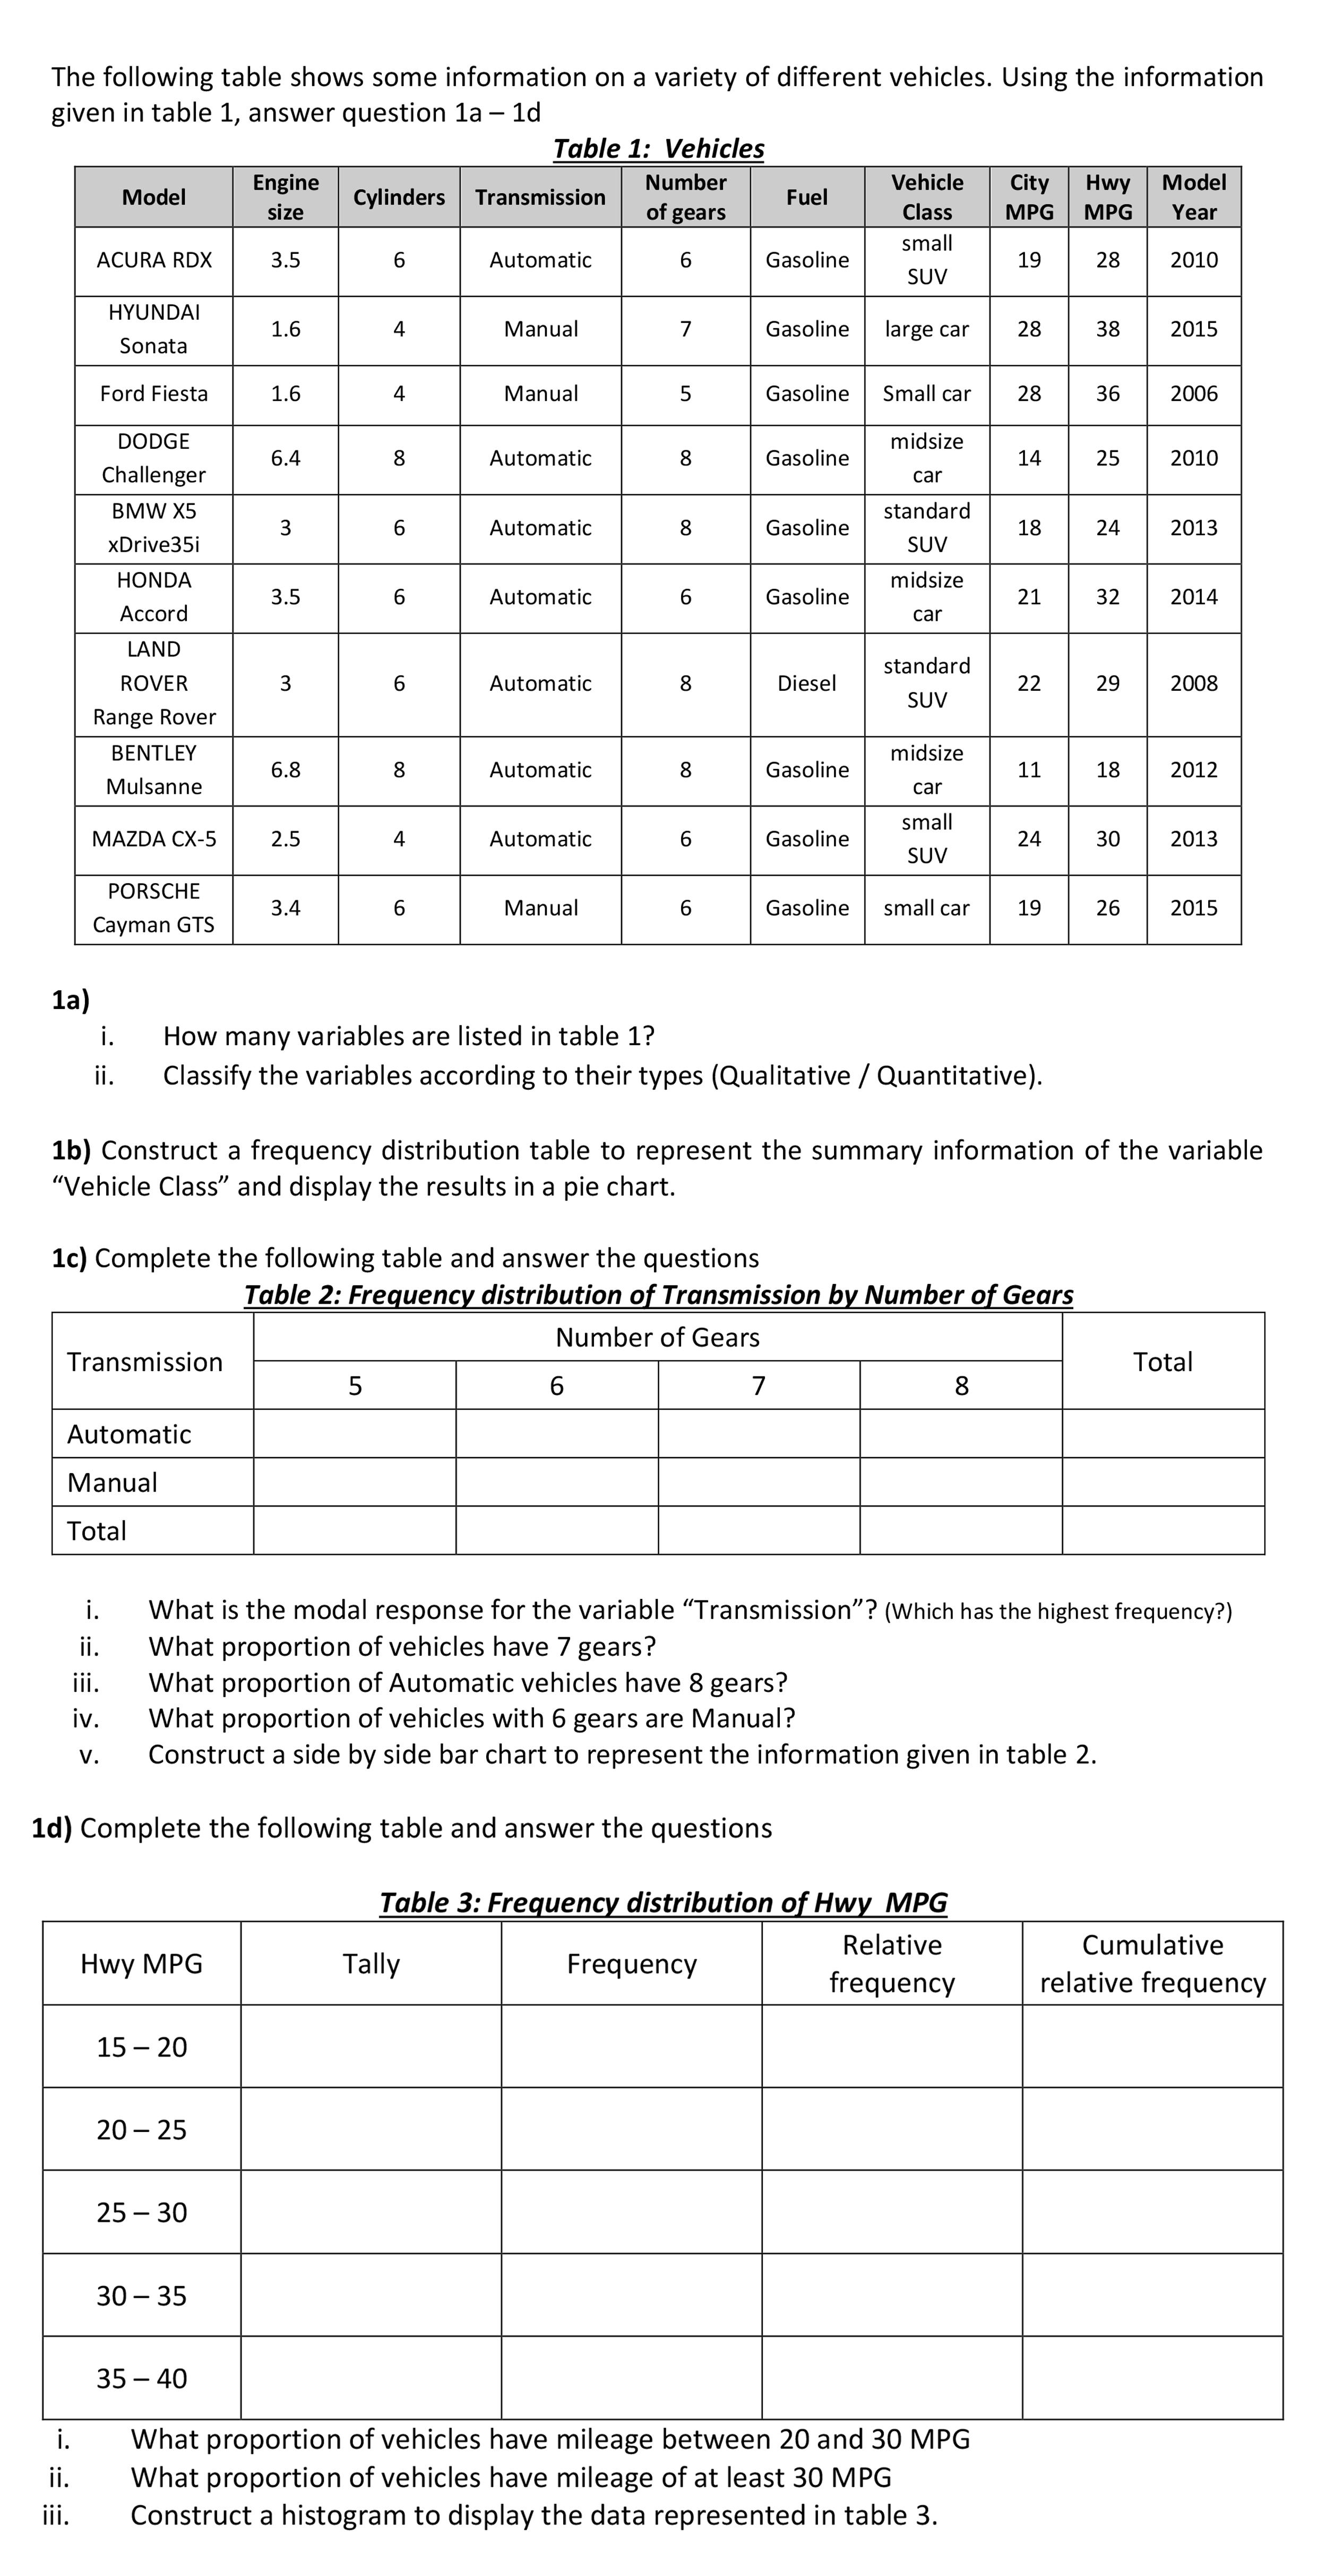
The following table shows some information on a variety of different vehicles. Using the information given in table 1, answer question 1a – 1d - Table 1: Vehicles Engine Number Vehicle City Hwy Model Model Cylinders Transmission Fuel size of gears Class MPG MPG Year small ACURA RDX 3.5 Automatic Gasoline 19 28 2010 SUV HYUNDAI 1.6 4 Manual 7 Gasoline large car 28 38 2015 Sonata Ford Fiesta 1.6 4 Manual Gasoline Small car 28 36 2006 DODGE midsize 6.4 8. Automatic 8. Gasoline 14 25 2010 Challenger car BMW X5 standard 3 6 Automatic 8 Gasoline 18 24 2013 xDrive35i SUV HONDA midsize 3.5 Automatic Gasoline 21 32 2014 Аccord car LAND standard ROVER 3 6. Automatic 8 Diesel 22 29 2008 SUV Range Rover BENTLEY midsize 6.8 8. Automatic 8 Gasoline 11 18 2012 Mulsanne car small MAZDA CX-5 2.5 4 Automatic Gasoline 24 30 2013 SUV PORSCHE 3.4 6. Manual Gasoline small car 19 26 2015 Cayman GTS 1a) i. How many variables are listed in table 1? ii. Classify the variables according to their types (Qualitative / Quantitative). 1b) Construct a frequency distribution table to represent the summary information of the variable "Vehicle Class" and display the results in a pie chart. 1c) Complete the following table and answer the questions Table 2: Frequency distribution of Transmission by Number of Gears Number of Gears Transmission Total 6. 7 8 Automatic Manual Total What is the modal response for the variable "Transmission"? (Which has the highest frequency?) What proportion of vehicles have 7 gears? What proportion of Automatic vehicles have 8 gears? What proportion of vehicles with 6 gears are Manual? Construct a side by side bar chart to represent the information given in table 2. i. i. ii. iv. V. 1d) Complete the following table and answer the questions Table 3: Frequency distribution of Hwy MPG Relative Cumulative Hwy MPG Tally Frequency frequency relative frequency 15 – 20 20 – 25 25 – 30 30 – 35 35 – 40 What proportion of vehicles have mileage between 20 and 30 MPG What proportion of vehicles have mileage of at least 30 MPG Construct a histogram to display the data represented in table 3. i. ii. ii. The following table shows some information on a variety of different vehicles. Using the information given in table 1, answer question 1a – 1d - Table 1: Vehicles Engine Number Vehicle City Hwy Model Model Cylinders Transmission Fuel size of gears Class MPG MPG Year small ACURA RDX 3.5 Automatic Gasoline 19 28 2010 SUV HYUNDAI 1.6 4 Manual 7 Gasoline large car 28 38 2015 Sonata Ford Fiesta 1.6 4 Manual Gasoline Small car 28 36 2006 DODGE midsize 6.4 8. Automatic 8. Gasoline 14 25 2010 Challenger car BMW X5 standard 3 6 Automatic 8 Gasoline 18 24 2013 xDrive35i SUV HONDA midsize 3.5 Automatic Gasoline 21 32 2014 Аccord car LAND standard ROVER 3 6. Automatic 8 Diesel 22 29 2008 SUV Range Rover BENTLEY midsize 6.8 8. Automatic 8 Gasoline 11 18 2012 Mulsanne car small MAZDA CX-5 2.5 4 Automatic Gasoline 24 30 2013 SUV PORSCHE 3.4 6. Manual Gasoline small car 19 26 2015 Cayman GTS 1a) i. How many variables are listed in table 1? ii. Classify the variables according to their types (Qualitative / Quantitative). 1b) Construct a frequency distribution table to represent the summary information of the variable "Vehicle Class" and display the results in a pie chart. 1c) Complete the following table and answer the questions Table 2: Frequency distribution of Transmission by Number of Gears Number of Gears Transmission Total 6. 7 8 Automatic Manual Total What is the modal response for the variable "Transmission"? (Which has the highest frequency?) What proportion of vehicles have 7 gears? What proportion of Automatic vehicles have 8 gears? What proportion of vehicles with 6 gears are Manual? Construct a side by side bar chart to represent the information given in table 2. i. i. ii. iv. V. 1d) Complete the following table and answer the questions Table 3: Frequency distribution of Hwy MPG Relative Cumulative Hwy MPG Tally Frequency frequency relative frequency 15 – 20 20 – 25 25 – 30 30 – 35 35 – 40 What proportion of vehicles have mileage between 20 and 30 MPG What proportion of vehicles have mileage of at least 30 MPG Construct a histogram to display the data represented in table 3. i. ii. ii.
Expert Answer:
Answer rating: 100% (QA)
solution la i 10 variables or features of interest ii QUALITA... View the full answer

Posted Date:
Students also viewed these mathematics questions
-
The Internal Revenue Service provides information on a variety of tax issues in its publication series. These publications can be found on the IRS World Wide Web site...
-
The Internal Revenue Service provides information on a variety of tax issues in its publication series. These publications can be found on the IRS Web site (www.irs.gov/formspubs/index.html). Go to...
-
Using the information given in P15- 1 and P15- 2, record the transactions in general journal form. Then, post the journal entries to ledger T- accounts, like those shown in Table 15- 11. (To help...
-
Walmart Stores has run into opposition when it has tried to open stores in certain towns in the United States. Walmarts capital budgeting process has determined that these locations would be...
-
What is the unauthorized practice of law?
-
Illustrate l Hospitals Rule by graphing both f(x)/g(x) and f(x)/g(x) near x = 0 to see that these ratios have the same limit as x → 0. Also calculate the exact value of the limit. 65. f(x) = e -...
-
The notes to financial statements present information on significant accounting policies, complex or special transactions, details of reported amounts, commitments, contingencies, segments, quarterly...
-
Sports Emporium has two operating segments: sporting goods and sports apparel. The income statement for each operating segment is presented below. Required: 1. Complete the % columns to be used in a...
-
A loan of $ 1 0 , 0 0 0 is being repaid with annual payments over 1 0 years at 8 % compound monthly. Find the interes paid and the capital payments in year Please explain step by step
-
The proposed rates were not in the range the CEO expected given the pricing analysis. The CEO has asked the pricing actuary to verify the total projected loss cost excluding potential large storm...
-
Statistics plays and important role in the field of artificial intelligence (AI) and machine Learning For this discussion thread please post the following: 1) A hyperlink to a website that explores...
-
A KPU student purchased 1 5 0 shares of ABC Corp. at a price of $ 1 6 per share. One year later, the student sold the shares at $ 2 0 each. Calculate the amount of federal income tax that the student...
-
1. Given the following NFA over the alphabet = {a,b}, a) Convert it into its equivalent DFA. b) Give an informal description in English of what language these finite automata accept. a a 3 a,b 2
-
York's outstanding stock consists of 90,000 shares of cumulative 7.0% preferred stock with a $5 par value and also 160,000 shares of common stock with a $1 par value. During its first four years of...
-
Given the following compressed HTML, would applying position:relative; to the first div, after rendering, change the layout rendering in any way?...
-
Evaluate the integral. (Use C for the constant of integration.) 1 dx (+2 +4x+5)
-
Eighty units of end item X are needed at the beginning of week 6, and another 30 units are needed at the beginning of week 8. X B(2) D(3) D(2) F(2) Prepare a material requirements plan for component...
-
If a test has high reliability. O the test measures what the authors of the test claim it measures O people who take the same test twice get approximately the same scores both times O scores on the...
-
The following information is available for Jay Company: Calculate the following ratios for 2019: a. Gross profit percentage b. Return on sales c. Asset turnover d. Return on assets e. Return on...
-
Ritter Company has a current ratio of 3.00 on December 31. On that date the company's current assets are as follows: Ritter Company's current liabilities at the beginning of the year were \(\$...
-
Ritter Company, whose current assets at December 31 are shown in Exercise E13-6A, had net sales for the year of \(\$ 850,000\) and cost of goods sold of \(\$ 550,000\). At the beginning of the year,...

Study smarter with the SolutionInn App