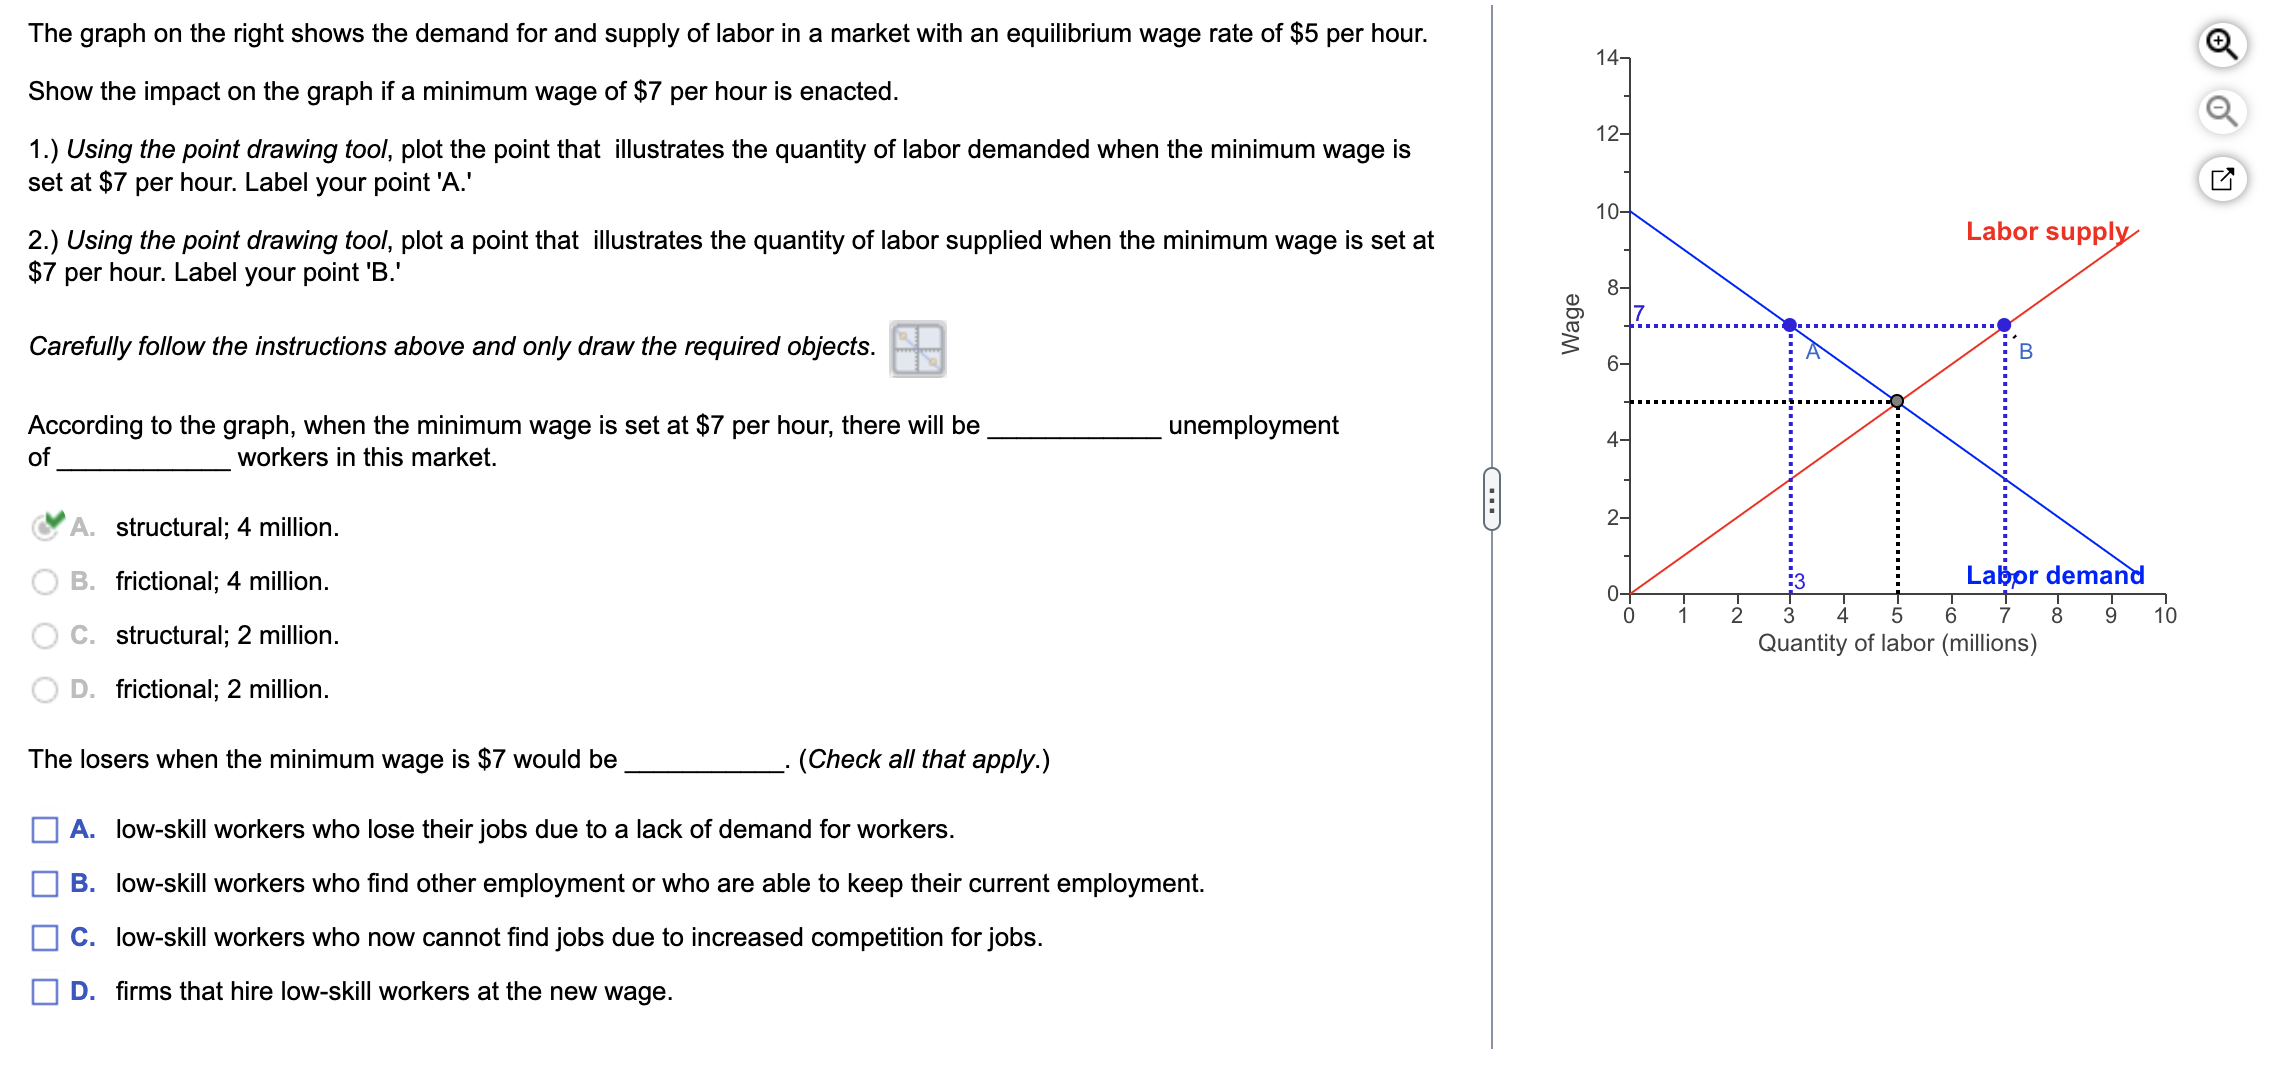
The graph on the right shows the demand for and supply of labor in a market...
Fantastic news! We've Found the answer you've been seeking!
Question:
Transcribed Image Text:
The graph on the right shows the demand for and supply of labor in a market with an equilibrium wage rate of $5 per hour. Show the impact on the graph if a minimum wage of $7 per hour is enacted. 1.) Using the point drawing tool, plot the point that illustrates the quantity of labor demanded when the minimum wage is set at $7 per hour. Label your point 'A.' 2.) Using the point drawing tool, plot a point that illustrates the quantity of labor supplied when the minimum wage is set at $7 per hour. Label your point 'B.' Carefully follow the instructions above and only draw the required objects. According to the graph, when the minimum wage is set at $7 per hour, there will be workers in this market. unemployment of A. structural; 4 million. B. frictional; 4 million. C. structural; 2 million. D. frictional; 2 million. The losers when the minimum wage is $7 would be (Check all that apply.) A. low-skill workers who lose their jobs due to a lack of demand for workers. B. low-skill workers who find other employment or who are able to keep their current employment. C. low-skill workers who now cannot find jobs due to increased competition for jobs. D. firms that hire low-skill workers at the new wage. C Wage 14- 12- 10- 8- 7 6- 4- 2- Labor supply Labor demand 4 5 6 7 8 9 10 Quantity of labor (millions) Q The graph on the right shows the demand for and supply of labor in a market with an equilibrium wage rate of $5 per hour. Show the impact on the graph if a minimum wage of $7 per hour is enacted. 1.) Using the point drawing tool, plot the point that illustrates the quantity of labor demanded when the minimum wage is set at $7 per hour. Label your point 'A.' 2.) Using the point drawing tool, plot a point that illustrates the quantity of labor supplied when the minimum wage is set at $7 per hour. Label your point 'B.' Carefully follow the instructions above and only draw the required objects. According to the graph, when the minimum wage is set at $7 per hour, there will be workers in this market. unemployment of A. structural; 4 million. B. frictional; 4 million. C. structural; 2 million. D. frictional; 2 million. The losers when the minimum wage is $7 would be (Check all that apply.) A. low-skill workers who lose their jobs due to a lack of demand for workers. B. low-skill workers who find other employment or who are able to keep their current employment. C. low-skill workers who now cannot find jobs due to increased competition for jobs. D. firms that hire low-skill workers at the new wage. C Wage 14- 12- 10- 8- 7 6- 4- 2- Labor supply Labor demand 4 5 6 7 8 9 10 Quantity of labor (millions) Q
Expert Answer:
Answer rating: 100% (QA)
Answer To illustrate the impact of a minimum wage of 7 per hour on the demand for and supply of labo... View the full answer
Related Book For
Posted Date:
Students also viewed these economics questions
-
What types/ of microscopy use beams of electrons instead of visible light??
-
CANMNMM January of this year. (a) Each item will be held in a record. Describe all the data structures that must refer to these records to implement the required functionality. Describe all the...
-
Ari Goldstein issued $300,000 of 11%, five-year bonds payable on January 1, 2024. The market interest rate at the date of issuance was 10%, and the bonds pay interest semiannually. Requirements 1....
-
The owner of a restaurant that serves Continental-style entrees has the business objective of learning more about the patterns of patron demand during the Friday-to-Sunday weekend time period. Data...
-
On July 1, 2013, Fontaine Company purchased for cash 40% of the outstanding capital stock of Knoblett Company. Both Fontaine Company and Knoblett Company have a December 31 year-end. Knoblett...
-
How many ways can a company select 4 candidates to interview from a short list of 12 engineers?
-
Blake, a recent accounting program graduate, earned the following during the year: Gross income from employment.....................................$7,000 Provincial lottery...
-
Linux Construct a similar process tree on using pstree. You can store it in a file using redirection: pstree > hw3tree. Print it out and turn it in pdf form. Note that just using pstree may not be...
-
15. Dividends in arrears are dividends on (a) cumulative preferred shares that have been declared but have not been paid. (b) non-cumiulative preferred shares that have not been declared for a given...
-
How does industrialization fundamentally alter the economic structure of societies, transitioning from agrarian-based economies to industrialized ones?
-
Consider a home mortgage of $150,000 at a fixed APR of 4.5% for 25 years. a. Calculate the monthly payment. b. Determine the total amount paid over the term of the loan. c. Of the total amount paid,...
-
Explain the concept of social entrepreneurship with theoretical models and examples. Give some suggestions, on how the Prime Group Sri Lanka in the discussion can be involved in social...
-
The Tolar Corporation has 400 obsolete desk calculators that are carried in inventory at a total cost of $576,000. If these calculators are upgraded at a total cost of $100,000, they can be sold for...
-
How do government policies and regulations influence the trajectory and outcomes of industrialization, including factors such as labor rights, environmental protection, and economic development...
-
How are government and not-for-profit organizations audited? Be sure to include the different types of audits.
-
If the cylinder described in Problem 21.3 were initially heated to 500F, how long would it take for the center of the cylinder to cool to 240F if it were constructed of a. Copper? b. Brass? c. Nickel?
-
The circuit diagram for a rectifier is sometimes drawn with a resistor in the center. Would the rectifier function if this resistor were replaced by a capacitor?
-
The rectifier shown in Figure P32.28 converts the alternating emf from an \(\mathrm{AC}\) source to a positive-only potential difference from a to \(\mathrm{b}\). Sketch graphs showing \((a)\) the...
-
The logic gate in Figure P32.30 contains four field-effect transistors. Each of the gates A-D of the transistors may be positively biased ( \(\mathrm{Y}\) in the table) or not ( \(\mathrm{N}\) in the...
Study smarter with the SolutionInn App