

When calculating statistics from data, it is important to recognize when you are working with a...
Fantastic news! We've Found the answer you've been seeking!
Question:
Transcribed Image Text:
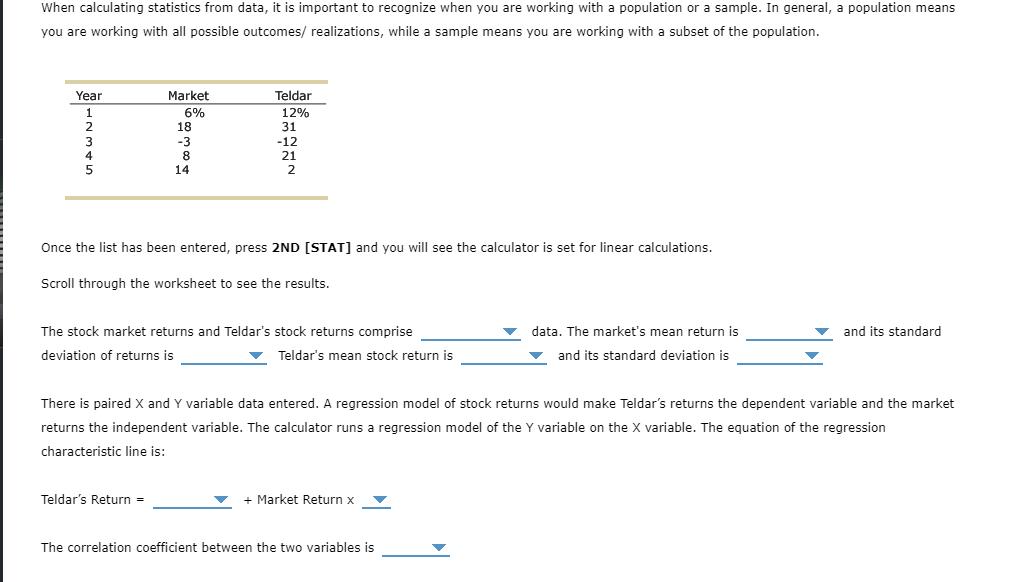
When calculating statistics from data, it is important to recognize when you are working with a population or a sample. In general, a population means you are working with all possible outcomes/ realizations, while a sample means you are working with a subset of the population. Year 1 2 3 4 Market 6% 18 -3 8 14 Teldar 12% 31 Teldar's Return = -12 21 2 Once the list has been entered, press 2ND [STAT] and you will see the calculator is set for linear calculations. Scroll through the worksheet to see the results. The stock market returns and Teldar's stock returns comprise deviation of returns is ✓ Teldar's mean stock return is There is paired X and Y variable data entered. A regression model of stock returns would make Teldar's returns the dependent variable and the market returns the independent variable. The calculator runs a regression model of the Y variable on the X variable. The equation of the regression characteristic line is:: + Market Return x data. The market's mean return is and its standard deviation is The correlation coefficient between the two variables is and its standard When calculating statistics from data, it is important to recognize when you are working with a population or a sample. In general, a population means you are working with all possible outcomes/ realizations, while a sample means you are working with a subset of the population. Year 1 2 3 4 Market 6% 18 -3 8 14 Teldar 12% 31 Teldar's Return = -12 21 2 Once the list has been entered, press 2ND [STAT] and you will see the calculator is set for linear calculations. Scroll through the worksheet to see the results. The stock market returns and Teldar's stock returns comprise deviation of returns is ✓ Teldar's mean stock return is There is paired X and Y variable data entered. A regression model of stock returns would make Teldar's returns the dependent variable and the market returns the independent variable. The calculator runs a regression model of the Y variable on the X variable. The equation of the regression characteristic line is:: + Market Return x data. The market's mean return is and its standard deviation is The correlation coefficient between the two variables is and its standard When calculating statistics from data, it is important to recognize when you are working with a population or a sample. In general, a population means you are working with all possible outcomes/ realizations, while a sample means you are working with a subset of the population. Year 1 2 3 4 Market 6% 18 -3 8 14 Teldar 12% 31 Teldar's Return = -12 21 2 Once the list has been entered, press 2ND [STAT] and you will see the calculator is set for linear calculations. Scroll through the worksheet to see the results. The stock market returns and Teldar's stock returns comprise deviation of returns is ✓ Teldar's mean stock return is There is paired X and Y variable data entered. A regression model of stock returns would make Teldar's returns the dependent variable and the market returns the independent variable. The calculator runs a regression model of the Y variable on the X variable. The equation of the regression characteristic line is:: + Market Return x data. The market's mean return is and its standard deviation is The correlation coefficient between the two variables is and its standard When calculating statistics from data, it is important to recognize when you are working with a population or a sample. In general, a population means you are working with all possible outcomes/ realizations, while a sample means you are working with a subset of the population. Year 1 2 3 4 Market 6% 18 -3 8 14 Teldar 12% 31 Teldar's Return = -12 21 2 Once the list has been entered, press 2ND [STAT] and you will see the calculator is set for linear calculations. Scroll through the worksheet to see the results. The stock market returns and Teldar's stock returns comprise deviation of returns is ✓ Teldar's mean stock return is There is paired X and Y variable data entered. A regression model of stock returns would make Teldar's returns the dependent variable and the market returns the independent variable. The calculator runs a regression model of the Y variable on the X variable. The equation of the regression characteristic line is:: + Market Return x data. The market's mean return is and its standard deviation is The correlation coefficient between the two variables is and its standard When calculating statistics from data, it is important to recognize when you are working with a population or a sample. In general, a population means you are working with all possible outcomes/ realizations, while a sample means you are working with a subset of the population. Year 1 2 3 4 Market 6% 18 -3 8 14 Teldar 12% 31 Teldar's Return = -12 21 2 Once the list has been entered, press 2ND [STAT] and you will see the calculator is set for linear calculations. Scroll through the worksheet to see the results. The stock market returns and Teldar's stock returns comprise deviation of returns is ✓ Teldar's mean stock return is There is paired X and Y variable data entered. A regression model of stock returns would make Teldar's returns the dependent variable and the market returns the independent variable. The calculator runs a regression model of the Y variable on the X variable. The equation of the regression characteristic line is:: + Market Return x data. The market's mean return is and its standard deviation is The correlation coefficient between the two variables is and its standard When calculating statistics from data, it is important to recognize when you are working with a population or a sample. In general, a population means you are working with all possible outcomes/ realizations, while a sample means you are working with a subset of the population. Year 1 2 3 4 Market 6% 18 -3 8 14 Teldar 12% 31 Teldar's Return = -12 21 2 Once the list has been entered, press 2ND [STAT] and you will see the calculator is set for linear calculations. Scroll through the worksheet to see the results. The stock market returns and Teldar's stock returns comprise deviation of returns is ✓ Teldar's mean stock return is There is paired X and Y variable data entered. A regression model of stock returns would make Teldar's returns the dependent variable and the market returns the independent variable. The calculator runs a regression model of the Y variable on the X variable. The equation of the regression characteristic line is:: + Market Return x data. The market's mean return is and its standard deviation is The correlation coefficient between the two variables is and its standard
Expert Answer:
Answer rating: 100% (QA)
SOLUTION To calculate the statistics and regression results w... View the full answer

Related Book For 
Auditing A Practical Approach
ISBN: 9780730382645
4th Edition
Authors: Robyn Moroney, Fiona Campbell, Jane Hamilton
Posted Date:
Students also viewed these finance questions
-
dy 1. 2. For each differential equation, find the particular solution that passes through the given point. 3 sin(2x); (,-1) (0.3) 3. = +1 and y'(5)=-1 and y(5)=-
-
Managing Scope Changes Case Study Scope changes on a project can occur regardless of how well the project is planned or executed. Scope changes can be the result of something that was omitted during...
-
Planning is one of the most important management functions in any business. A front office managers first step in planning should involve determine the departments goals. Planning also includes...
-
A charge q is placed a distance from the origin, and a charge 2q is placed a distance 2r. There is a charge Q at the origin. If a charges are positive, which charge is at the higher potential? A q B)...
-
Somewhere between Earth and the Moon, gravity from these two bodies on a space pod would cancel. Is this location nearer Earth or the Moon?
-
The following incomplete balance sheet for the Sanderson Manufacturing Company was prepared by the company's controller. As accounting manager for Sanderson, you are attempting to reconstruct and...
-
Wayflaire Inc. produces home products. The cost to manufacture a case ( 36 sets) of its most popular set of casual dinnerware is as follows: The average sales price for a case of dinnerware is \(\$...
-
Dons Luxury Travel in Problem 8-9A keeps employee earnings records. Judy Carson, employee number 62, is employed as a manager in the ticket sales department. She was born on May 8, 1959, and was...
-
Are there any measures or metrics for global supply chains? What impact have they experienced since the pandemic and the war in Ukraine? How are global supply chains changing due to these factors
-
Sandra?s Purse Boutique has the following transactions related to its top-selling Gucci purse for the month of October. Required: 1. Calculate ending inventory and cost of goods sold at October 31,...
-
"Buying a call option is very dangerous because it commits the owner to purchasing a currency at a later date. At that time, the currency may be undesirable. Therefore, owning a call option is a...
-
Golden Manufacturers provides you with the following data: Cost of goods sold, 3,600,000; Raw materials used, P1,500,000; Labor cost, P1,000,000; Factory overhead, P1,000,000. Ending inventory of...
-
Viena is a regional firm that offers audit, tax, and consulting services. The partners are concerned about the profitability of their audit business, and a closure decision might be forthcoming. If...
-
The price of a telescope purchased by Future Labs Inc. was $32,100. It cost $898 for delivery. The salvage value at the end of 3 years is $6,764. Using the 150% declining-balance depreciation method,...
-
The COSSAC Co. Charges manufacturing overhead into production at the rate of P10 per direct labor hour, base on standard production of 15000 direct labor hours for 15000 units: 60% manufacturing...
-
Bern, Inc. is considering dropping one product line due to continuing losses.If the product line is discontinued, then Bern could avoid $111,300 per year in fixed costs.Revenue and cost data for the...
-
A car and a bus set out at 2 pm from the same spot, headed in the same direction. The average speed of the car is twice the average speed of the bus. After 2 hours, the car is 68 miles ahead of the...
-
Outline a general process applicable to most control situations. Using this, explain how you would develop a system to control home delivery staff at a local pizza shop.
-
Auditing cash receipts: (a) Can provide evidence about the balance of accounts receivable. (b) Could reveal unusual delays in posting credits to debtors accounts. (c) Can reveal cut-off problems. (d)...
-
A sample audit report is provided in figure 1.2 in this chapter. A sample review engagement report is provided. Required (a) Explain the relevance of the paragraphs "Management's responsibility for...
-
When testing controls the auditor: (a) Is interested in assessing the effectiveness of controls. (b) Gathers evidence about the balances of the main accounts. (c) Does not have to have any prior...
-
The Arcadia Company bid on a multiyear contract to construct the new hockey arena for the Phoenix Coyotes. The contract required that construction begin not later than January 1, 2015, and be...
-
Forms are provided in the Working Papers. Your instructor will guide you through the following examples. 1. Create a schedule that shows the payment of an annuity over a four-year period. The initial...
-
The Hilton Company sells inexpensive furniture on installment plans to customers that have poor credit. Many of the companys customers are sometimes not able to make the required payments, forcing...

Study smarter with the SolutionInn App