

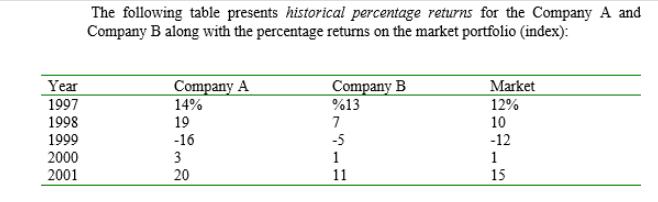
Year 1997 1998 1999 2000 2001 The following table presents historical percentage returns for the Company...
Fantastic news! We've Found the answer you've been seeking!
Question:
Expert Answer:
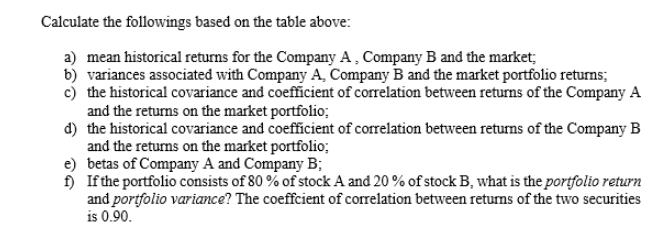
To calculate the requested values well use the given historical percentage returns for Company A Company B and the market portfolio Lets go step by step a Mean Historical Returns The mean historical r... View the full answer

Related Book For 

Posted Date:
