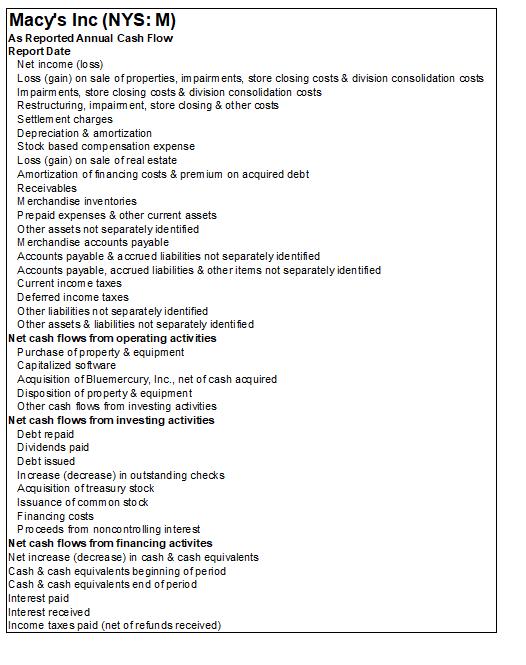
You are a financial analyst. Based on your analysis of Macys financial statements, provide a report to
Question:
You are a financial analyst. Based on your analysis of Macy’s financial statements, provide a report to guide investors whether Macy’s is a buy (keep) or sell stock. Your report should include the following
a. An interpretation of trends illustrated by supportive ratios, horizontal and vertical analysis and focus on the main ratios that “tell the story”. (a minimum of one page-not to exceed two pages, single space, 12 font size).
i. horizontal and vertical analysis
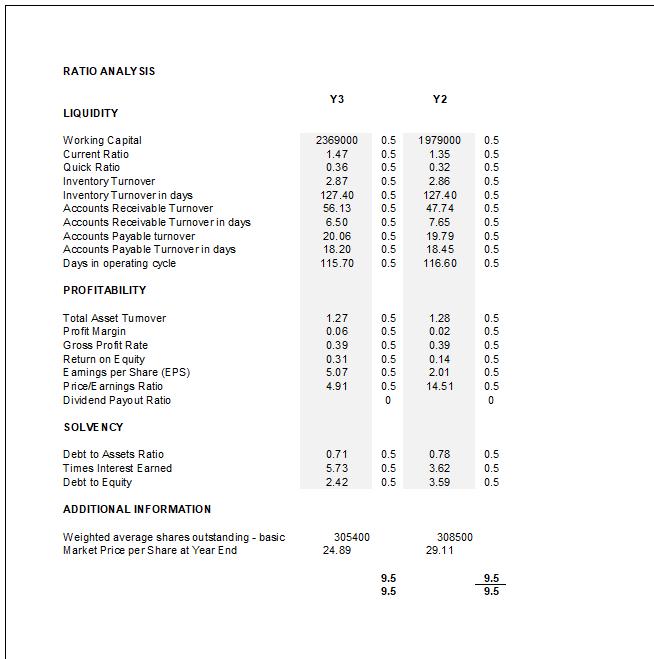
ii. Liquidity analysis
iii. Profitability analysis
iv. Solvency analysis
b. Your informed recommendation (buy or sell) about Macy’s with justifications. What is your general impression about Macy’s ? Support your conclusion (1- paragraph)
Macy's Inc (NYS: M) As Reported Annual Balance Sheet Report Date Cash & cash equivalents Receivables Merchandise inventories Prepaid expenses & other current asset Total current accet Land Buildings on owned land Buildings on leased land & leasehold improve Fixtures & equipment Leased properties under capitalized leases Property & equipment, at cost Less accumulated depreciation & amortization Property & equipment, not Goodw Other intangible assets, not other assets Total accets Senior debentures Senior notes Capital lease & current portion of other long-term obligat Short-tem debt Merchandise accounts payable Accounts payable Gift cards & customer award certificates Accrued wages & vacation Cument portion of post employment & postretirement be Taxes other than income taxes Severance & relocation Lease related liabilities Cument portion of workers' compensation & general labi Restructuring accruals, Induding severance Allowance for future sales returns Accrued interest Deferred real estate gains Other accounts payable & accrued liablites Accounts payable & accrued labiles Income taxes Deferred Income taxes Total current lab Senior notes Senior debentures Amortizing debentures Un amortized debt issue cost Un amortized debt discount Promlum on acquired debt Capital lease & other long-term obligations Long-term debt Deferred Income taxes Other Tables Total Liabilities Common stock Additional paidin capital Accumulated equity (det) Treasury stock Accumulated other comprehensive Income (los) Total Macy's, Inc. shareholders equity (deficit) Noncontrolling interest Total shareholdere equity Y3 1,455,000 363,000 5,178,000 22.000 22,000 1.590,000 735,000 967,000 229,000 194,000 157,000 189,000 108.000 448,000 7,444,000 1,494,000 4.106.000 1,444.000 1,545,000 1,672,000 4,204,000 4,541,000 4,910,000 34,000 34,000 34,000 11,282,000 11,873,000 12,935.000 4.610.000 4,856.000 5,319,000 6,672.000 7,017.000 7.616.000 3,897,000 3,897,000 3,897,000 488.000 880,000 514.000 897,000 498.000 813.000 18,861,000 20,678,000 300.000 18,381,000 93,000 90,000 70,000 65,000 270,000 3,167,000 296.000 Y2 1,297,000 522.000 5,861,000 1,122,000 1,662.000 1,109,000 558,000 5,399,000 5,506,000 408,000 479,000 7,828,000 7,862,000 1,541,000 1,629,000 4.212,000 4,690,000 3.000 676,000 7.174.000 1.456.000 9,000 309.000 1,423,000 754,000 970,000 215,000 208.000 166,000 166,000 174,000 119,000 - 96,000 74.000 340,000 281.000 3,563,000 352,000 Y1 59.000 577.000 6,000 642,000 1.526.000 814,000 920.000 (896,000) 4,323,000 (724,000) 5,673,000 (12.000) (1,000) 6,881,000 4,322,000 153,000 257,000 184,000 123,000 165.000 127,000 6,076,000 6,847,000 6,728,000 2,021,000 4,000,000 4,000,000 3,769,000 2,437,000 2,845,000 16.000 22.000 26,000 (25.000) (29,000) (32.000) (13,000) (16,000) (16,000) 67,000 121,000 143,000 26,000 27.000 29,000 88.000 112,000 6,562,000 6,995.000 1.443.000 1,477,000 1,877,000 2.123.000 13,720,000 16,620,000 16,323,000 390,000 3,333,000 227,000 .. 3,000 3,000 617,000 6,088,000 6.334,000 621,000 1,489,000 1,665,000 (1.043,000) 4,250,000 3,000 4,263,000 Horizontal Ana y cic (Y3/Y2) 12.2% -30.5% 4.1% 9.8% -2.4% 3.0% -2.5% 6.5% -7.4% 0.0% 5.0% 4.1% 4.9% 0.0% -2.0% 8.2% -2.4% #VALUE! #VALUE! 144.4% -92.9% 11.7% -2.5% -0.3% 6.5% 6.7% -5.4% #VALUE! 8.6% -9.2% #VALUE! 4.3% -5.4% 80.9% -3.9% -11.1% -15.9% #VALUE! -10.1% 49.5% 54.7% -27.3% -13.8% -18.8% 44.6% 3.7% -10.7% -22.2% -11.5% -11.6% 0.0% 9.6% 17.8% -2.2% -19.2% 31.2% 1100.0% 31.0% 0.1 0.1 0.1 0.1 0.1 0.1 0.1 0.1 0.1 0.1 0.1 0.1 0.1 0.1 0.1 0.1 0.1 0.1 0.1 0.1 0.1 0.1 0.1 0.1 0.1 0.1 0.1 0.1 0.1 0.1 0.1 0.1 0.1 0.1 0.1 0.1 0.1 0.1 0.1 0.1 0.1 0.1 0.1 0.1 0.1 0.1 0.1 0.1 0.1 0.1 Vertical Analysis YS 7.5% 1.9% 26.7% 2.3% 38.4% 7.7% 21.2% 7.5% 21.7% 0.2% 58.2% 23.8% 34.4% 20.1% 2.5% 4.5% 100.0% 0.1% 0.1% 8.2% 3.8% 5.0% 1.2% 1.0% 0.8% #VALUE! 1.0% 0.6% 0.5% 0.5% 0.4% 0.3% 1.4% 16.3% 1.5% #VALUE! 26.2% 10.4% 19.4% 0.1% -0.1% -0.1% 0.3% 0.1% 30.2% 5.8% 8.6% 70.8% 0.0% 3.5% 37.0% 7.5% -3.7% 29.3% -0.1% 29.2% 0.1 0.1 0.1 0.1 0.1 0.1 0.1 0.1 0.1 0.1 0.1 0.1 0.1 0.1 0.1 0.1 0.1 0.1 0.1 0.1 0.1 0.1 0.1 0.1 0.1 55 0.1 0.1 0.1 0.1 0.1 0.1 0.1 0.1 0.1 0.1 0.1 0.1 0.1 0.1 0.1 0.1 0.1 0.1 0.1 0.1 0.1 0.1 0.1 0.1 0.1 0.1 0.1 0.1 0.1 텦 Vertical Analysis Y2 6.5% 2.6% 27.2% 2.1% 38,4% 7.8% 21.2% 7.8% 22.9% 0.2% 50.8% 24.5% 35.3% 19.6% 2.5% 4.1% 100.0% 1.5% #VALUE! 0.0% 1.6% 7.2% 3.8% 4.9% 1.1% 1.0% 0.8% 0.8% 0.9% 0.6% #VALUE! 0.5% 0.4% 1.7% 1.4% 17.9% 1.8% #VALUE! 28.4% 20.2% 12.3% 0.1% -0.1% -0.1% 0.6% 0.1% 33,1% 7.3% 9.5% 78.2% 0.0% 3.1% 30.7% 7.5% 4.5% 21.8% 0.0% 21.8% 0.1 0.1 0.1 0.1 0.1 0.1 0.1 0.1 0.1 0.1 0.1 0.1 0.1 0.1 0.1 0.1 0.1 0.1 0.1 5 6 ને તે છે કે કોઈ તેને 0.1 0.1 0.1 0.1 0.1 0.1 0.1 0.1 0.1 0.1 0.1 0.1 0.1 0.1 0.1 0.1 0.1 0.1 0.1 0.1 0.1 0.1 0.1 0.1 0.1 0.1 0.1 0.1 0.1 0.1 0.1 0.1 0.1 0.1 6.6 6.6 Macy's Inc (NYS: M) As Reported Annual Balance Sheet Report Date Cash & cash equivalents Receivables Merchandise inventories Prepaid expenses & other current asset Total current accet Land Buildings on owned land Buildings on leased land & leasehold improve Fixtures & equipment Leased properties under capitalized leases Property & equipment, at cost Less accumulated depreciation & amortization Property & equipment, not Goodw Other intangible assets, not other assets Total accets Senior debentures Senior notes Capital lease & current portion of other long-term obligat Short-tem debt Merchandise accounts payable Accounts payable Gift cards & customer award certificates Accrued wages & vacation Cument portion of post employment & postretirement be Taxes other than income taxes Severance & relocation Lease related liabilities Cument portion of workers' compensation & general labi Restructuring accruals, Induding severance Allowance for future sales returns Accrued interest Deferred real estate gains Other accounts payable & accrued liablites Accounts payable & accrued labiles Income taxes Deferred Income taxes Total current lab Senior notes Senior debentures Amortizing debentures Un amortized debt issue cost Un amortized debt discount Promlum on acquired debt Capital lease & other long-term obligations Long-term debt Deferred Income taxes Other Tables Total Liabilities Common stock Additional paidin capital Accumulated equity (det) Treasury stock Accumulated other comprehensive Income (los) Total Macy's, Inc. shareholders equity (deficit) Noncontrolling interest Total shareholdere equity Y3 1,455,000 363,000 5,178,000 22.000 22,000 1.590,000 735,000 967,000 229,000 194,000 157,000 189,000 108.000 448,000 7,444,000 1,494,000 4.106.000 1,444.000 1,545,000 1,672,000 4,204,000 4,541,000 4,910,000 34,000 34,000 34,000 11,282,000 11,873,000 12,935.000 4.610.000 4,856.000 5,319,000 6,672.000 7,017.000 7.616.000 3,897,000 3,897,000 3,897,000 488.000 880,000 514.000 897,000 498.000 813.000 18,861,000 20,678,000 300.000 18,381,000 93,000 90,000 70,000 65,000 270,000 3,167,000 296.000 Y2 1,297,000 522.000 5,861,000 1,122,000 1,662.000 1,109,000 558,000 5,399,000 5,506,000 408,000 479,000 7,828,000 7,862,000 1,541,000 1,629,000 4.212,000 4,690,000 3.000 676,000 7.174.000 1.456.000 9,000 309.000 1,423,000 754,000 970,000 215,000 208.000 166,000 166,000 174,000 119,000 - 96,000 74.000 340,000 281.000 3,563,000 352,000 Y1 59.000 577.000 6,000 642,000 1.526.000 814,000 920.000 (896,000) 4,323,000 (724,000) 5,673,000 (12.000) (1,000) 6,881,000 4,322,000 153,000 257,000 184,000 123,000 165.000 127,000 6,076,000 6,847,000 6,728,000 2,021,000 4,000,000 4,000,000 3,769,000 2,437,000 2,845,000 16.000 22.000 26,000 (25.000) (29,000) (32.000) (13,000) (16,000) (16,000) 67,000 121,000 143,000 26,000 27.000 29,000 88.000 112,000 6,562,000 6,995.000 1.443.000 1,477,000 1,877,000 2.123.000 13,720,000 16,620,000 16,323,000 390,000 3,333,000 227,000 .. 3,000 3,000 617,000 6,088,000 6.334,000 621,000 1,489,000 1,665,000 (1.043,000) 4,250,000 3,000 4,263,000 Horizontal Ana y cic (Y3/Y2) 12.2% -30.5% 4.1% 9.8% -2.4% 3.0% -2.5% 6.5% -7.4% 0.0% 5.0% 4.1% 4.9% 0.0% -2.0% 8.2% -2.4% #VALUE! #VALUE! 144.4% -92.9% 11.7% -2.5% -0.3% 6.5% 6.7% -5.4% #VALUE! 8.6% -9.2% #VALUE! 4.3% -5.4% 80.9% -3.9% -11.1% -15.9% #VALUE! -10.1% 49.5% 54.7% -27.3% -13.8% -18.8% 44.6% 3.7% -10.7% -22.2% -11.5% -11.6% 0.0% 9.6% 17.8% -2.2% -19.2% 31.2% 1100.0% 31.0% 0.1 0.1 0.1 0.1 0.1 0.1 0.1 0.1 0.1 0.1 0.1 0.1 0.1 0.1 0.1 0.1 0.1 0.1 0.1 0.1 0.1 0.1 0.1 0.1 0.1 0.1 0.1 0.1 0.1 0.1 0.1 0.1 0.1 0.1 0.1 0.1 0.1 0.1 0.1 0.1 0.1 0.1 0.1 0.1 0.1 0.1 0.1 0.1 0.1 0.1 Vertical Analysis YS 7.5% 1.9% 26.7% 2.3% 38.4% 7.7% 21.2% 7.5% 21.7% 0.2% 58.2% 23.8% 34.4% 20.1% 2.5% 4.5% 100.0% 0.1% 0.1% 8.2% 3.8% 5.0% 1.2% 1.0% 0.8% #VALUE! 1.0% 0.6% 0.5% 0.5% 0.4% 0.3% 1.4% 16.3% 1.5% #VALUE! 26.2% 10.4% 19.4% 0.1% -0.1% -0.1% 0.3% 0.1% 30.2% 5.8% 8.6% 70.8% 0.0% 3.5% 37.0% 7.5% -3.7% 29.3% -0.1% 29.2% 0.1 0.1 0.1 0.1 0.1 0.1 0.1 0.1 0.1 0.1 0.1 0.1 0.1 0.1 0.1 0.1 0.1 0.1 0.1 0.1 0.1 0.1 0.1 0.1 0.1 55 0.1 0.1 0.1 0.1 0.1 0.1 0.1 0.1 0.1 0.1 0.1 0.1 0.1 0.1 0.1 0.1 0.1 0.1 0.1 0.1 0.1 0.1 0.1 0.1 0.1 0.1 0.1 0.1 0.1 텦 Vertical Analysis Y2 6.5% 2.6% 27.2% 2.1% 38,4% 7.8% 21.2% 7.8% 22.9% 0.2% 50.8% 24.5% 35.3% 19.6% 2.5% 4.1% 100.0% 1.5% #VALUE! 0.0% 1.6% 7.2% 3.8% 4.9% 1.1% 1.0% 0.8% 0.8% 0.9% 0.6% #VALUE! 0.5% 0.4% 1.7% 1.4% 17.9% 1.8% #VALUE! 28.4% 20.2% 12.3% 0.1% -0.1% -0.1% 0.6% 0.1% 33,1% 7.3% 9.5% 78.2% 0.0% 3.1% 30.7% 7.5% 4.5% 21.8% 0.0% 21.8% 0.1 0.1 0.1 0.1 0.1 0.1 0.1 0.1 0.1 0.1 0.1 0.1 0.1 0.1 0.1 0.1 0.1 0.1 0.1 5 6 ને તે છે કે કોઈ તેને 0.1 0.1 0.1 0.1 0.1 0.1 0.1 0.1 0.1 0.1 0.1 0.1 0.1 0.1 0.1 0.1 0.1 0.1 0.1 0.1 0.1 0.1 0.1 0.1 0.1 0.1 0.1 0.1 0.1 0.1 0.1 0.1 0.1 0.1 6.6 6.6
Expert Answer:
Based on my analysis of Macys financial statements over the past two years I recommend selling Macys ... View the full answer
Students also viewed these finance questions
-
Prepare a simplified balance sheet and income statement projecting the growth of Walgreens-Boots Alliance, Inc. for the fiscal year ending 8/31/2022. Assume no new issues of equity. Projections can...
-
Produce the following calculations: Gross & Net Margin, EBIT & AT Inventory Turnover ROA, EBIT & AT ROE, AT Current Ratio Debt/Equity Receivables turnover Fixed asset turnover Total asset...
-
Presented below are excerpts from Note 1 to Starbucks' September 30, 2012, consolidated financial statements in which Starbucks describes accounting policy for long-lived assets. a. Leasehold...
-
Figure 11-31 shows a cooling curve for a Pb-Sn alloy. Determine (a) The pouring temperature; (b) The superheat; (c) The liquidus temperature; (d) The eutectic temperature; (e) The freezing range; (f)...
-
What is the notion of triangulation in global market research?
-
Ann and Tom want to establish a fund for their grandson's college education. What lump sum must they deposit at a 6% annual interest rate, compounded quarterly, in order to have $60,000 in the fund...
-
You have received a job offer from a startup company headed by \(\mathrm{PhD}\) chemists to be their chief (and only) process engineer, responsible to move their process for a novel solid adhesive...
-
The following data were accumulated for use in reconciling the bank account of Commander Co. for March: a. Cash balance according to the companys records at March 31, $13,065. b. Cash balance...
-
Pension fund UPNC has a fixed-income portfolio consisting of A=600M in assets and L=700M in liabilities. The duration of the assets is D A =16 and that of the liabilities is D L =27. To bring the...
-
As the manager of credit card services at Bank of Hanover (BOH), you're aware that the average profitability of a credit card customer grows with the number of years they have used the credit card....
-
Boris Corporation is financed with 49 percent debt and the rest equity. It has a leveraged beta of 1.0 and is subject to a 45% corporate tax rate. What is Boris's unleveraged beta? Round the answer...
-
The board of directors of Fast & Furious Inc., a manufacturer of sports equipment, has decided to install a new management position, Supply Chain Management, that is planned to report directly to the...
-
Explain how theory can contribute to explaining collaboration between firms in general and how theory can support supply chain practitioners in performing their job.
-
Describe how the supply chain concept has extended the traditional view on logistics.
-
How has consumer behavior, especially in the western industrialized nations, been driven by new logistical developments and what challenges have emerged in recent years?
-
Your company has recently moved from single sourcing to dual sourcing, adding a second supplier for a key component of your product. While the relation with the incumbent supplier is based on a long...
-
General partners have unlimited liability with respect to partnership debt if the partnership goes out of business and is unable to pay its debt. Conversely, a limited partner is only responsible for...
-
Using the parallel-axis theorem, determine the product of inertia of the area shown with respect to the centroidal x and y axes. 6 in. 9 in. 9 in- 4.5 in. in. 4.5 in.
-
The Budwell & Son Oil Company is looking at two drilling proposals. One project lasts for three years, costs $20 million to start, pays back quickly, and has an NPV of $15 million. The other project...
-
Watson Waterbed Works Inc. has an EBIT of $2.75 million, can borrow at 15% interest, and pays combined state and federal income taxes of 40%. It currently has no debt and is capitalized by equity of...
-
Inflation is expected to be 5% next year and a steady 7% each year thereafter. Maturity risk premiums are zero for one-year debt but have an increasing value for longer debt. One-year government debt...
-
(a) Which of the 10 groups has the highest credit card debt and what is the amount? (b) Which of the groups has the least amount of credit card debt? (c) Can you identify any pattern between married...
-
(a) Which college has the greatest difference in starting salaries? (b) Which college has the highest starting salary for females? (c) Which college has the highest starting salary for males? (d)...
-
(a) How many of male respondents in this study had some college degree? (b) How would you describe the largest group of respondents? (c) What could be stated about the differences between male and...
Study smarter with the SolutionInn App