

You are asked to analyze the company financial statements from different perspectives to assess how the...
Fantastic news! We've Found the answer you've been seeking!
Question:
Transcribed Image Text:
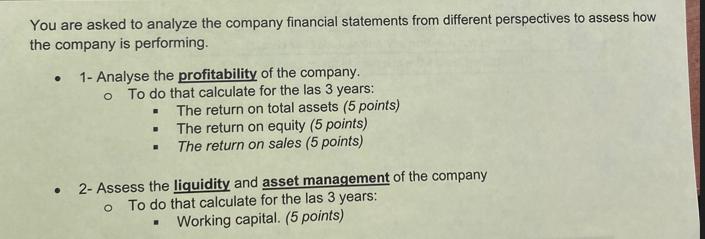
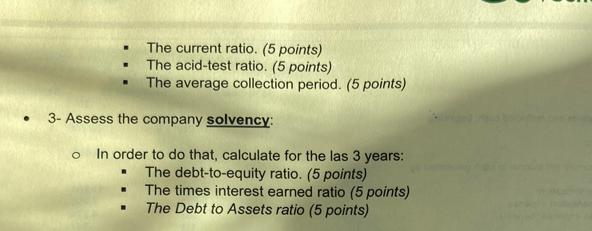
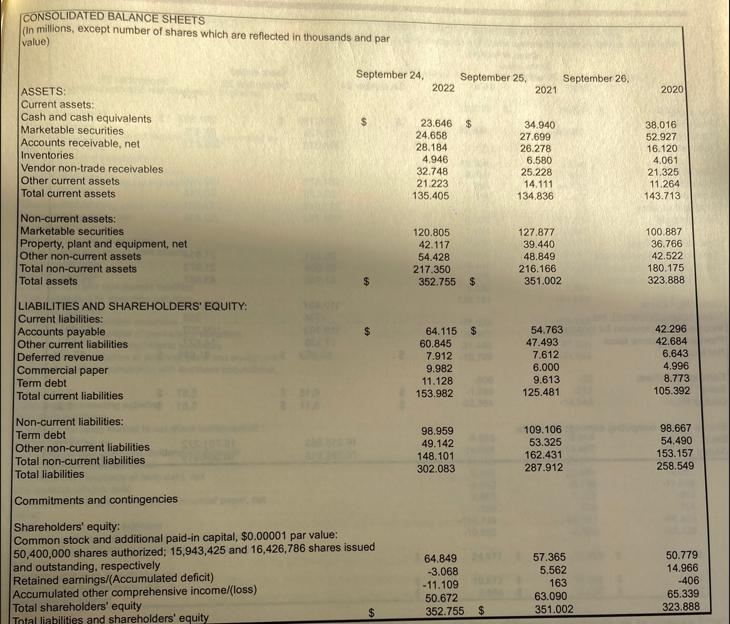
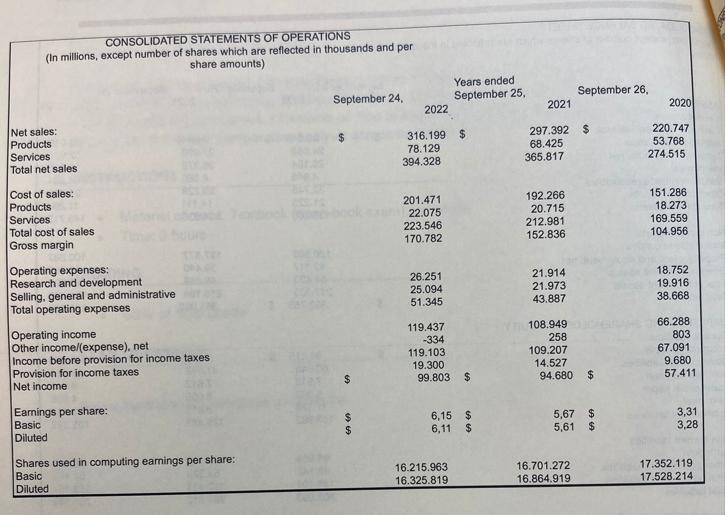
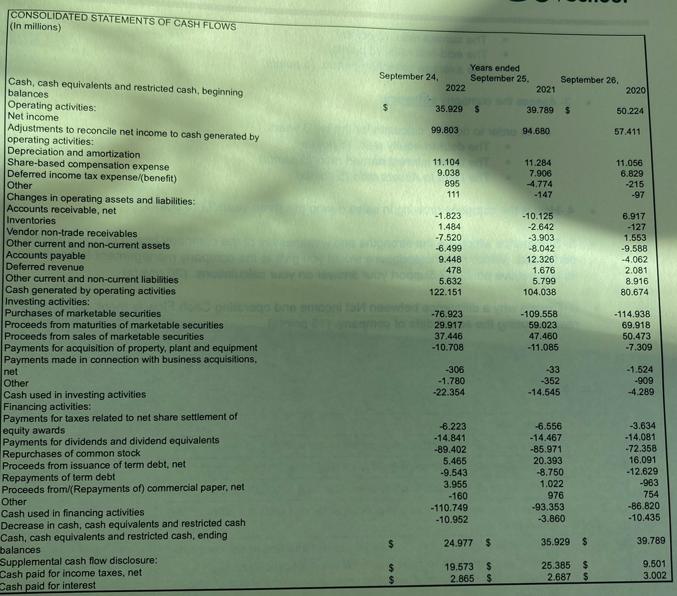
You are asked to analyze the company financial statements from different perspectives to assess how the company is performing. ● 1- Analyse the profitability of the company. o To do that calculate for the las 3 years: The return on total assets (5 points) The return on equity (5 points) The return on sales (5 points) . ■ 2- Assess the liquidity and asset management of the company O To do that calculate for the las 3 years: Working capital. (5 points) . The current ratio. (5 points) The acid-test ratio. (5 points) The average collection period. (5 points) 3- Assess the company solvency: o In order to do that, calculate for the las 3 years: The debt-to-equity ratio. (5 points) The times interest earned ratio (5 points) The Debt to Assets ratio (5 points) CONSOLIDATED BALANCE SHEETS (In millions, except number of shares which are reflected in thousands and par value) ASSETS: Current assets: Cash and cash equivalents Marketable securities Accounts receivable, net, Inventories Vendor non-trade receivables Other current assets Total current assets Non-current assets: Marketable securities Property, plant and equipment, net Other non-current assets Total non-current assets Total assets LIABILITIES AND SHAREHOLDERS' EQUITY: Current liabilities: Accounts payable Other current liabilities Deferred revenue Commercial paper Term debt Total current liabilities Non-current liabilities: Term debt Other non-current liabilities Total non-current liabilities Total liabilities Commitments and contingencies Shareholders' equity: Common stock and additional paid-in capital, $0.00001 par value: 50,400,000 shares authorized; 15,943,425 and 16,426,786 shares issued and outstanding, respectively Retained earnings/(Accumulated deficit) Accumulated other comprehensive income/(loss) September 24, Total shareholders' equity Total liabilities and shareholders' equity $ 2022 23.646 $ 24.658 28.184 4.946 32,748 21.223 135.405 120.805 42.117 54.428 217.350 352.755 $ 64.115 $ 60.845 7.912 9.982 September 25, 11.128 153.982 98.959 49.142 148.101 302.083 64.849 -3.068 -11.109 50.672 352.755 $ 2021 34.940 27.699 26.278 6.580 25.228 14.111 134,836 127.877 39.440 48.849 216.166 351.002 54.763 47.493 7.612 6.000 9.613 125.481 109.106 53.325 September 26, 162.431 287.912 57.365 5.562 163 63.090 351.002 2020 38.016 52.927 16.120 4.061 21.325 11.264 143.713 100.887 36.766 42.522 180.175 323.888 42.296 42.684 6.643 4.996 8.773 105.392 98.667 54.490 153.157 258.549 50.779 14.966 -406 65.339 323.888 TIL THE CONSOLIDATED STATEMENTS OF OPERATIONS (In millions, except number of shares which are reflected in thousands and per share amounts) Net sales: Products Services Total net sales Cost of sales: Products Services Total cost of sales Gross margin Operating expenses: Research and development Selling, general and administrative Total operating expenses Operating income Other income/(expense), net Income before provision for income taxes Provision for income taxes Net income Earnings per share: Basic Diluted Shares used in computing earnings per share: Basic Diluted September 24, 69 569 2022 316.199 $ 78.129 394.328 201.471 22.075 223.546 170.782 26.251 25.094 51.345 Years ended September 25, 119.437 -334 119.103 19.300 99.803 $ 6,15 $ 6,11 $ 16.215.963 16.325.819 2021 297.392 $ 68.425 365.817 192.266 20.715 212.981 152.836 21.914 21.973 43.887 September 26, 108.949 258 109.207 14.527 94.680 $ 5,67 $ 5,61 $ 16.701.272 16.864.919 2020 220.747 53.768 274.515 151.286 18.273 169.559 104.956 18.752 19.916 38.668 66.288 803 67.091 9.680 57.411 3,31 3,28 17.352.119 17.528.214 CONSOLIDATED STATEMENTS OF CASH FLOWS (In millions) Cash, cash equivalents and restricted cash, beginning balances Operating activities: Net income Adjustments to reconcile net income to cash generated by operating activities: Depreciation and amortization Share-based compensation expense Deferred income tax expense/(benefit) Other Changes in operating assets and liabilities: Accounts receivable, net Inventories Vendor non-trade receivables Other current and non-current assets Accounts payable Deferred revenue Other current and non-current liabilities Cash generated by operating activities Investing activities: Purchases of marketable securities Proceeds from maturities of marketable securities Proceeds from sales of marketable securities Payments for acquisition of property, plant and equipment Payments made in connection with business acquisitions, net Other Cash used in investing activities Financing activities: Payments for taxes related to net share settlement of equity awards Payments for dividends and dividend equivalents Repurchases of common stock Proceeds from issuance of term debt, net- Repayments of term debt Proceeds from/(Repayments of) commercial paper, net Other Cash used in financing activities Decrease in cash, cash equivalents and restricted cash Cash, cash equivalents and restricted cash, ending balances Supplemental cash flow disclosure: Cash paid for income taxes, net Cash paid for interest September 24, $ 2022 35.929 $ 99.803 11.104 9.038 895 111 -1.823 1.484 -7.520 -6.499 9.448 478 5.632 122.151 -76.923 29.917 37.446 -10.708 -306 -1.780 -22.354 -6.223 -14.841 -89.402 5.465 -9.543 3.955 -160 Years ended September 25, -110.749 -10.952 24.977 $ 19.573 $ 2.865 $ 2021 39.789 $ 94.680 11.284 7.906 -4.774 -147 -10.125 -2.642 -3.903 -8.042 12.326 1.676 5.799 104.038 September 26, -109.558 59.023 47.460 -11.085 -33 -352 -14.545 -6.556 -14.467 -85.971 20.393 -8.750 1.022 976 -93.353 -3.860 35.929 $ 25.385 $ 2.687 $ 2020 50.224 57.411 11.056 6.829 -215 -97 6.917 -127 1.553 -9.588 -4.062 2.081 8.916 80.674 -114.938 69.918 50.473 -7.309 -1.524 -909 -4.289 -3.634 -14.081 -72.358 16.091 -12.629 -963 754 -86.820 -10.435 39.789 9.501 3.002 You are asked to analyze the company financial statements from different perspectives to assess how the company is performing. ● 1- Analyse the profitability of the company. o To do that calculate for the las 3 years: The return on total assets (5 points) The return on equity (5 points) The return on sales (5 points) . ■ 2- Assess the liquidity and asset management of the company O To do that calculate for the las 3 years: Working capital. (5 points) . The current ratio. (5 points) The acid-test ratio. (5 points) The average collection period. (5 points) 3- Assess the company solvency: o In order to do that, calculate for the las 3 years: The debt-to-equity ratio. (5 points) The times interest earned ratio (5 points) The Debt to Assets ratio (5 points) CONSOLIDATED BALANCE SHEETS (In millions, except number of shares which are reflected in thousands and par value) ASSETS: Current assets: Cash and cash equivalents Marketable securities Accounts receivable, net, Inventories Vendor non-trade receivables Other current assets Total current assets Non-current assets: Marketable securities Property, plant and equipment, net Other non-current assets Total non-current assets Total assets LIABILITIES AND SHAREHOLDERS' EQUITY: Current liabilities: Accounts payable Other current liabilities Deferred revenue Commercial paper Term debt Total current liabilities Non-current liabilities: Term debt Other non-current liabilities Total non-current liabilities Total liabilities Commitments and contingencies Shareholders' equity: Common stock and additional paid-in capital, $0.00001 par value: 50,400,000 shares authorized; 15,943,425 and 16,426,786 shares issued and outstanding, respectively Retained earnings/(Accumulated deficit) Accumulated other comprehensive income/(loss) September 24, Total shareholders' equity Total liabilities and shareholders' equity $ 2022 23.646 $ 24.658 28.184 4.946 32,748 21.223 135.405 120.805 42.117 54.428 217.350 352.755 $ 64.115 $ 60.845 7.912 9.982 September 25, 11.128 153.982 98.959 49.142 148.101 302.083 64.849 -3.068 -11.109 50.672 352.755 $ 2021 34.940 27.699 26.278 6.580 25.228 14.111 134,836 127.877 39.440 48.849 216.166 351.002 54.763 47.493 7.612 6.000 9.613 125.481 109.106 53.325 September 26, 162.431 287.912 57.365 5.562 163 63.090 351.002 2020 38.016 52.927 16.120 4.061 21.325 11.264 143.713 100.887 36.766 42.522 180.175 323.888 42.296 42.684 6.643 4.996 8.773 105.392 98.667 54.490 153.157 258.549 50.779 14.966 -406 65.339 323.888 TIL THE CONSOLIDATED STATEMENTS OF OPERATIONS (In millions, except number of shares which are reflected in thousands and per share amounts) Net sales: Products Services Total net sales Cost of sales: Products Services Total cost of sales Gross margin Operating expenses: Research and development Selling, general and administrative Total operating expenses Operating income Other income/(expense), net Income before provision for income taxes Provision for income taxes Net income Earnings per share: Basic Diluted Shares used in computing earnings per share: Basic Diluted September 24, 69 569 2022 316.199 $ 78.129 394.328 201.471 22.075 223.546 170.782 26.251 25.094 51.345 Years ended September 25, 119.437 -334 119.103 19.300 99.803 $ 6,15 $ 6,11 $ 16.215.963 16.325.819 2021 297.392 $ 68.425 365.817 192.266 20.715 212.981 152.836 21.914 21.973 43.887 September 26, 108.949 258 109.207 14.527 94.680 $ 5,67 $ 5,61 $ 16.701.272 16.864.919 2020 220.747 53.768 274.515 151.286 18.273 169.559 104.956 18.752 19.916 38.668 66.288 803 67.091 9.680 57.411 3,31 3,28 17.352.119 17.528.214 CONSOLIDATED STATEMENTS OF CASH FLOWS (In millions) Cash, cash equivalents and restricted cash, beginning balances Operating activities: Net income Adjustments to reconcile net income to cash generated by operating activities: Depreciation and amortization Share-based compensation expense Deferred income tax expense/(benefit) Other Changes in operating assets and liabilities: Accounts receivable, net Inventories Vendor non-trade receivables Other current and non-current assets Accounts payable Deferred revenue Other current and non-current liabilities Cash generated by operating activities Investing activities: Purchases of marketable securities Proceeds from maturities of marketable securities Proceeds from sales of marketable securities Payments for acquisition of property, plant and equipment Payments made in connection with business acquisitions, net Other Cash used in investing activities Financing activities: Payments for taxes related to net share settlement of equity awards Payments for dividends and dividend equivalents Repurchases of common stock Proceeds from issuance of term debt, net- Repayments of term debt Proceeds from/(Repayments of) commercial paper, net Other Cash used in financing activities Decrease in cash, cash equivalents and restricted cash Cash, cash equivalents and restricted cash, ending balances Supplemental cash flow disclosure: Cash paid for income taxes, net Cash paid for interest September 24, $ 2022 35.929 $ 99.803 11.104 9.038 895 111 -1.823 1.484 -7.520 -6.499 9.448 478 5.632 122.151 -76.923 29.917 37.446 -10.708 -306 -1.780 -22.354 -6.223 -14.841 -89.402 5.465 -9.543 3.955 -160 Years ended September 25, -110.749 -10.952 24.977 $ 19.573 $ 2.865 $ 2021 39.789 $ 94.680 11.284 7.906 -4.774 -147 -10.125 -2.642 -3.903 -8.042 12.326 1.676 5.799 104.038 September 26, -109.558 59.023 47.460 -11.085 -33 -352 -14.545 -6.556 -14.467 -85.971 20.393 -8.750 1.022 976 -93.353 -3.860 35.929 $ 25.385 $ 2.687 $ 2020 50.224 57.411 11.056 6.829 -215 -97 6.917 -127 1.553 -9.588 -4.062 2.081 8.916 80.674 -114.938 69.918 50.473 -7.309 -1.524 -909 -4.289 -3.634 -14.081 -72.358 16.091 -12.629 -963 754 -86.820 -10.435 39.789 9.501 3.002
Expert Answer:
Answer rating: 100% (QA)
To analyze the profitability of the company we will calculate the following financial ratios for the last three years 1 Return on Total Assets ROTA RO... View the full answer

Related Book For 
Financial Management for Public Health and Not for Profit Organizations
ISBN: 978-0132805667
4th edition
Authors: Steven A. Finkler, Thad Calabrese
Posted Date:
Students also viewed these accounting questions
-
Read the case study "Southwest Airlines," found in Part 2 of your textbook. Review the "Guide to Case Analysis" found on pp. CA1 - CA11 of your textbook. (This guide follows the last case in the...
-
The Weld, Bergevin, and Magrath article points out that if a company is going to intentionally manipulate earnings, they must be astute enough to present financial statements that still seem...
-
A crest vertical curve is to be designed to join a +2% grade with a -2% grade at a section of a two-lane highway. Determine the minimum length of the curve if the design speed of the highway is 60...
-
In Australia, the banking sector is dominated by four main institutions, the ANZ Banking Group, Commonwealth Bank, National Australia Bank, and Westpac. To maintain a competitive banking market, the...
-
Independent random samples of professional football and basketball players gave the following information (References: Sports Encyclopedia of Pro Football and Official NBA Basketball Encyclopedia)....
-
Fiendish Friends makes Halloween costumes. The company incurred the following total costs to produce 25,000 costumes. Direct materials....... $200,000 Direct labor........ 150,000 Variable...
-
connected Use the graphs and multigraphs shown. Identify any graphs and/or multigraphs with the given characteristics. If there are none, state so. W a m n M Graph 11 Graph 12 Graph 13 Multigraph 14...
-
1. How did an undergraduate student accomplish what the Department of Education, state and local school boards, and the national Parent-Teacher Association were unable to achieve despite trying for...
-
The management estimates total sales for the period January through July based on actual sales from the immediate past quarter. The following assumptions are made:Sales: Past and ExpectedOctober...
-
Which series has the highest beta. BraveNewCoin Liquid Index for Bitcoin 1D BNC Trading Brave Ne Yellow Green Blue Orange
-
QUESTION 1 When studying chilly classroom climates for female undergraduate students, quantitative research showed more of a chilly classroom climate than qualitative research qualitative research...
-
Bob has been offered a 20-year bond issued by a company at a price of $990. The bond has a coupon rate of 9% and pays the coupon semiannually. Similar bonds in the market will yield 7.7% today. What...
-
David is the wealthiest resident in his neighborhood. Some of his poorer neighbors have hacked his wireless internet so they can save money for more important things like food and health insurance....
-
The initial population in a bacteria colony is 10,000. After t hours, the colony has grown to a number P(t) given by P(t) = 10,000(1+0.86t+t) A. Find the rate of change of the population P with...
-
Unicloak Manufacturing Company's accrued factory payroll for the month ended October 31, 2020 amounted to P =335,800. Record shows that the following were deducted as a percentage of gross payroll:...
-
B: If they have 60% of their weight on their left foot and 40% on their right foot, how many Newtons does the right bathroom scale read?
-
Give graphic representations of: a. Empirical rule for , 20, 30 b. Standard normal distribution c. P(a < x < b) d. Normal distribution with different standard deviations but same n e. Standard normal...
-
Test whether the 5-year survival rate for breast cancer is significantly different between African American and Caucasian women who are younger than 50 years of age and have localized disease....
-
The fire department expected to spend $ 100,000 in April. Actually, it spent $ 108,680. The department thought it would pay each member of its team of fire-fighters $ 25 per hour. However, it paid...
-
What are the possible types of interfund transactions? Explain.
-
How can we obtain information for financial condition analysis?
-
This information is for OBrien Corporation for the year ended December 31, 2012. Instructions (a) Prepare the 2012 statement of cash flows for OBrien Corporation. (b) Suppose you are one of OBriens...
-
The following data are derived from the 2009 financial statements of Southwest Airlines. All dollars are in millions. Southwest has a December 31 year-end. Instructions (a) After analyzing the data,...
-
Gabelli Corporation was formed on January 1, 2012. At December 31, 2012, John Paulus, the president and sole stockholder, decided to prepare a balance sheet, which appeared as follows John willingly...

Study smarter with the SolutionInn App