

The data in the following table gives the monthly sales for a cosmetics manufacturer (left(y_{t} ight)) and
Question:
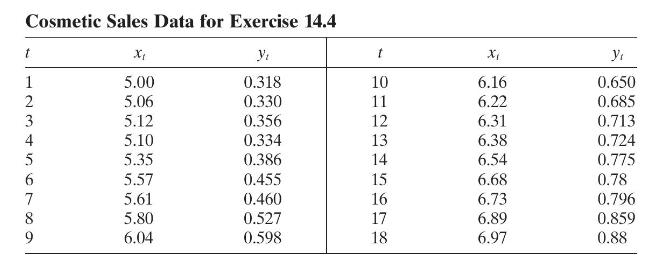
The data in the following table gives the monthly sales for a cosmetics manufacturer \(\left(y_{t}\right)\) and the corresponding monthly sales for the entire industry \(\left(x_{t}\right)\). The units of both variables are millions of dollars.
a. Build a simple linear regression model relating company sales to industry sales. Plot the residuals against time. Is there any indication of autocorrelation?
b. Use the Durbin-Watson test to determine if there is positive autocorrelation in the errors. What are your conclusions?
c. Use one iteration of the Cochrane-Orcutt procedure to estimate the model parameters. Compare the standard error of these regression coefficients with the standard error of the least-squares estimates.
d. Test for positive autocorrelation following the first iteration. Has the procedure been successful?
Step by Step Answer:

This question has not been answered yet.
You can Ask your question!


Introduction To Linear Regression Analysis
ISBN: 9781119578727
6th Edition
Authors: Douglas C. Montgomery, Elizabeth A. Peck, G. Geoffrey Vining
