

Refer to the Software Quality Professional (Nov. 2004) evaluation of the performance of a software engineering teams
Question:
Refer to the Software Quality Professional (Nov. 2004) evaluation of the performance of a software engineering team’s performance at Motorola, Inc., Exercise 5.42. Recall that the variable of interest was the number of updates to a file changed because of a problem report. The monthly number of updates reported by a particular team was recorded for 12 consecutive months. The data are shown in the accompanying table.
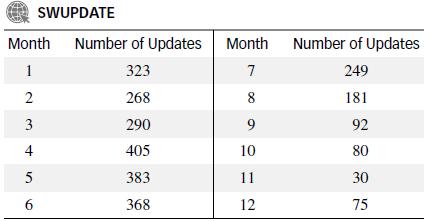
a. Locate the center line for a variable control chart of the data.
b. Locate the upper and lower control limits.
c. Is the process in control?
Data from Exercise 5.42
Software configuration management was used to monitor a software engineering team’s performance at Motorola, Inc. (Software Quality Professional, Nov. 2004). One of the variables of interest was the number of updates to a file changed because of a problem report. Summary statistics for n = 421 files yielded the following results: y̅ = 4.71, s = 6.09, Q1 = 1, and Q3 = 6. Are these data approximately normally distributed? Explain.
Step by Step Answer:


Statistics For Engineering And The Sciences
ISBN: 9781498728850
6th Edition
Authors: William M. Mendenhall, Terry L. Sincich
