

The data below shows birth rate and per capita income (in thousands of 2011 dollars) from 2000
Question:
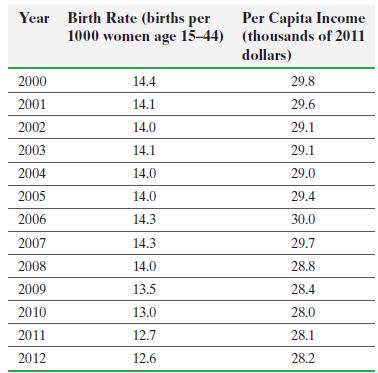
The data below shows birth rate and per capita income (in thousands of 2011 dollars) from 2000 through 2012. Draw a time-series plot for both birth rate and per capita income. Comment on any similarities in the trends.
Step by Step Answer:

This question has not been answered yet.
You can Ask your question!
Related Book For 

Statistics Informed Decisions Using Data
ISBN: 9781292157115
5th Global Edition
Authors: Michael Sullivan
Question Posted:
