

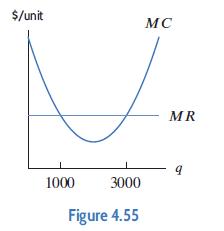
Figure 4.55 shows graphs of marginal cost and marginal revenue. Estimate the production levels that could maximize
Question:
Figure 4.55 shows graphs of marginal cost and marginal revenue. Estimate the production levels that could maximize profit. Explain your reasoning.
Fantastic news! We've Found the answer you've been seeking!
Step by Step Answer:
From the given graph we can sketch the graph of marginal profit ...View the full answer

Answered By
Gabriela Rosalía Castro
I have worked with very different types of students, from little kids to bussines men and women. I have thaught at universities, schools, but mostly in private sessions for specialized purpuses. Sometimes I tutored kids that needed help with their classes at school, some others were high school or college students that needed to prepare for an exam to study abroud. Currently I'm teaching bussiness English for people in bussiness positions that want to improve their skills, and preparing and ex-student to pass a standarized test to study in the UK.
1+ Reviews
10+ Question Solved
Related Book For 

Applied Calculus
ISBN: 9781119275565
6th Edition
Authors: Deborah Hughes Hallett, Patti Frazer Lock, Andrew M. Gleason, Daniel E. Flath, Sheldon P. Gordon, David O. Lomen, David Lovelock, William G. McCallum, Brad G. Osgood, Andrew Pasquale
Question Posted:
