

What would happen to the SML graph in Figure 8.8 if expected inflation increased or decreased? Figure
Question:
What would happen to the SML graph in Figure 8.8 if expected inflation increased or decreased?
Figure 8.8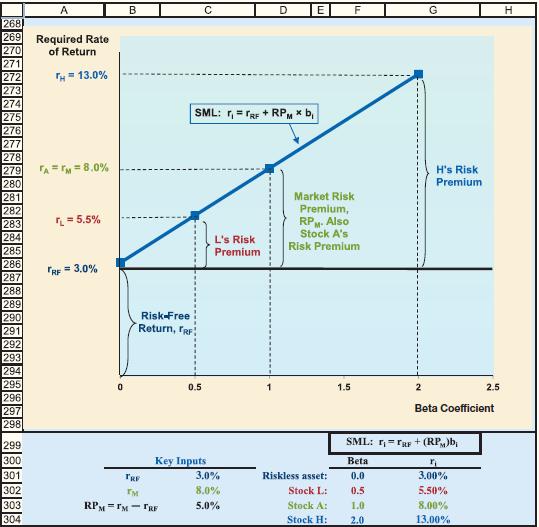
Fantastic news! We've Found the answer you've been seeking!
Step by Step Answer:
In Figure 88 the Security Market Line SML represents the relationship between the expected return and systematic risk beta of securities in the market ...View the full answer

Answered By
Benish Ahmad
I'm a professional software engineer. I'm lectutrer at GCUF and I have 3 years of teaching experience. I'm looking forward to getting mostly computer science work including:
Programming fundamentals
Object oriented programming
Data structures
object oriented design and analysis
Database system
Computer networks
Discrete mathematics
Web application
I am expert in different computer languages such as C++, java, JavaScript, Sql, CSS, Python and C#. I'm also have excellent knowledge of essay writing and research. I have worked in other Freelancing website such as Fiverr and Upwork. Now I have finally decided to join the SolutionInn platform to continue with my explicit work of helping dear clients and students to achieve their academic dreams. I deliver plagiarism free work and exceptional projects on time. I am capable of working under high pressure.
2+ Reviews
10+ Question Solved
Related Book For 

Fundamentals Of Financial Management
ISBN: 9780357517574
16th Edition
Authors: Eugene F. Brigham, Joel F. Houston
Question Posted:
