

Refer to the data for Wendys Widgets in M5-7-M5-9. Suppose that Wendys expect to sell 3,200 widgets
Question:
Refer to the data for Wendy’s Widgets in M5-7-M5-9. Suppose that Wendy’s expect to sell 3,200 widgets during the month of September and that each widget sells for $2.75. Using this information along with the regression results given in M5-9, prepare Wendy’s contribution margin income statement for the month of September.
Data from M5-9
Refer to the Wendy’s Widgets data in M5-7. Suppose Wendy performed a least-squares regression and obtained the following results.
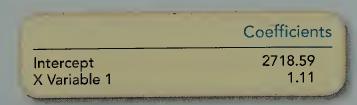
Put Wendy’s results into a linear equation format (Y = A + BX) and explain what each component means. Compare the regression results to those obtained in M5-7 and M5-8. Which method is most accurate? Why?
Data from M5-8
Refer to the Wendy’s Widgets data in M5-7. Using the high-low method, calculate the total fixed cost per month and the variable cost per widget. How does the estimate of fixed cost compare to what you estimated in M5-7?
Data from M5-7
Wendy’s Widgets builds the world’s best widgets. Information for the last eight months follows:
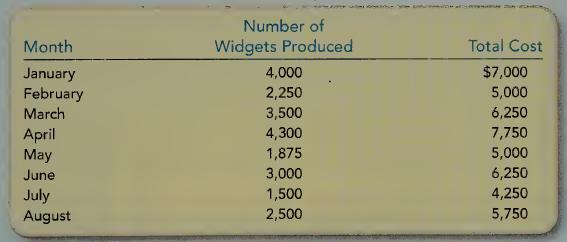
Prepare a scattergraph by plotting Wendy’s data on a graph. Then draw a line that you believe best fits the data points. Using the graph and line you have drawn, estimate Wendy’s total fixed cost per month.
Step by Step Answer:

This question has not been answered yet.
You can Ask your question!

Managerial Accounting
ISBN: 9780078110771
1st Edition
Authors: Stacey WhitecottonRobert LibbyRobert Libby, Patricia LibbyRobert Libby, Fred Phillips
