

The graphs below represent approximations of cost behavior patterns. The horizontal axis of each graph represents units
Question:
The graphs below represent approximations of cost behavior patterns. The horizontal axis of each graph represents units and the vertical axis represents dollars of total cost.
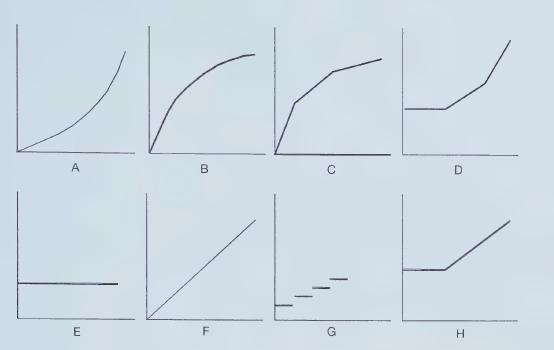
Select the graph that best matches each of the situations described below. Each graph may be selected more than once.
a. Straight-line depreciation of a factory building.
b. Utility bill for electricity that includes a fixed charge per month plus a constant usage rate per hour for hours in excess of 100.
c. Cost of microchip incorporated into a product.
d. Labor cost of machine operators who become more productive as they gain experience.
Water bill that includes a flat fee for the first 10,000 gallons used plus an increasing usage charge for each additional 10,000 gallons used.
e. Cost of factory supplies when increasing quantities bring cost discounts as each price break level is attained.
f. Salaries of quality inspectors when one additional inspector is hired for each 20,000 units produced.
g. Cost of an advertising campaign.
Step by Step Answer:

This question has not been answered yet.
You can Ask your question!


Managerial Accounting For Undergraduates
ISBN: 9781618531124
1st Edition
Authors: Christensen, Theodore E. Hobson, L. Scott Wallace, James S.
