Use the following set of independent variables ? SALTEACH, REVPUB, CLASS, and PECD ? to explain teacher
Question:
Use the following set of independent variables ? SALTEACH, REVPUB, CLASS, and PECD ? to explain teacher turnover rates (TETURN).
Do the full regression analysis. This means that you have to:
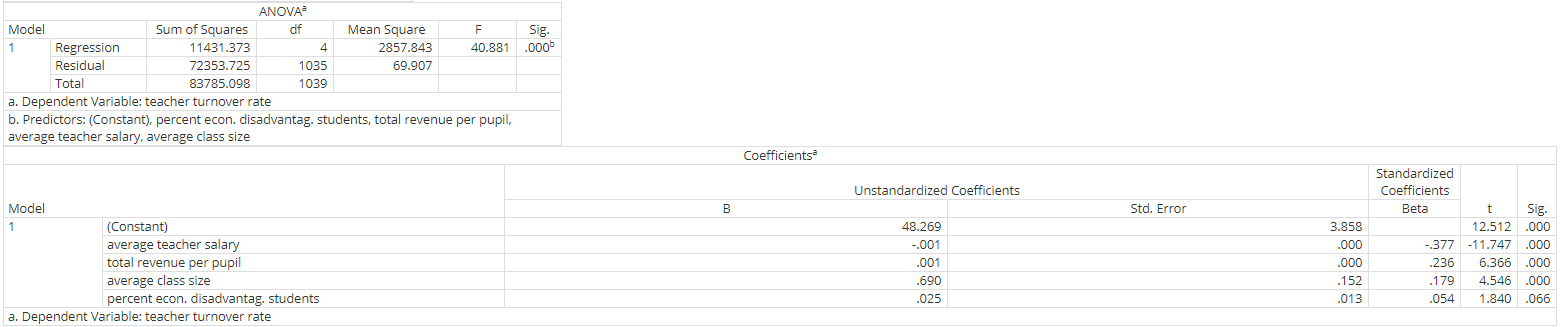
Estimate (multiple) regression equation
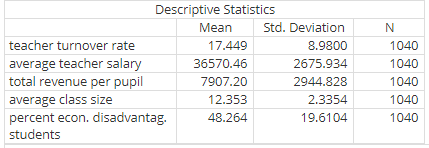
Interpret the intercept.
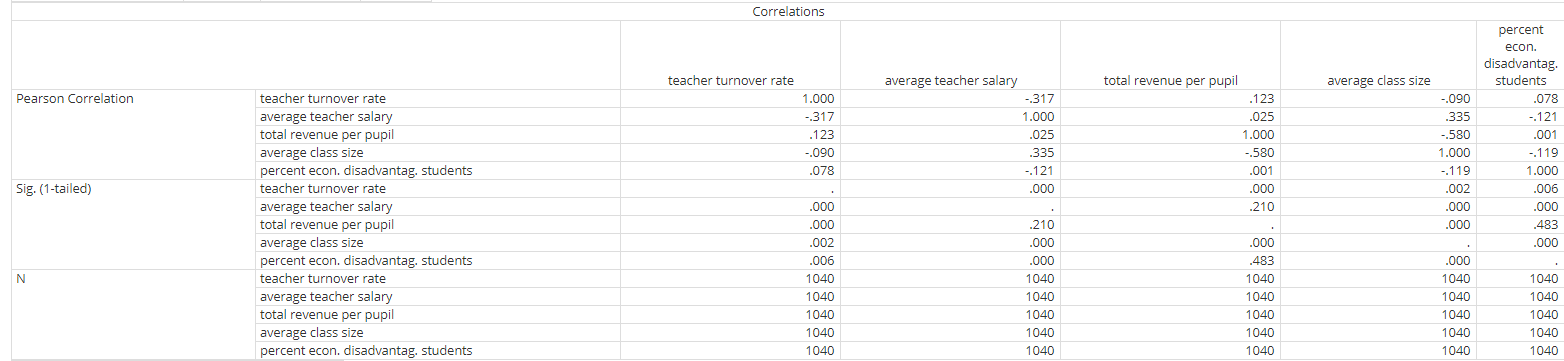
Which independent variables appear to have a significant effect on the dependent variable? Why?
For significant independent variables interpret the magnitude (b) of the relationships.
Interpret the beta weights: which variables appear to be the most important predictors of the on teacher turnover rates?
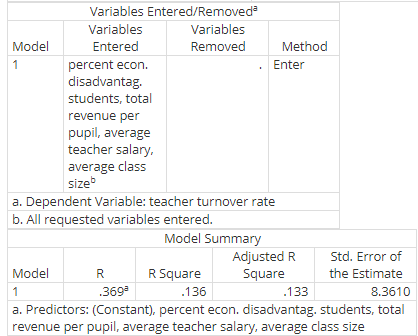
R Square (what percentage of the variation in the dependent variable could you explain? What percentage did you fail to explain?)
Is your model overall significant?
teacher turnover rate average teacher salary total revenue per pupil average class size Descriptive Statistics percent econ. disadvantag. students Mean 17.449 36570.46 7907.20 12.353 48.264 Std. Deviation 8.9800 2675.934 2944.828 2.3354 19.6104 N 1040 1040 1040 1040 1040 Pearson Correlation Sig. (1-tailed) N teacher turnover rate average teacher salary total revenue per pupil average class size percent econ. disadvantag. students teacher turnover rate average teacher salary total revenue per pupil average class size percent econ. disadvantag. students teacher turnover rate average teacher salary total revenue per pupil average class size percent econ. disadvantag. students Correlations teacher turnover rate 1.000 -317 .123 -.090 .078 .000 .000 .002 .006 1040 1040 1040 1040 1040 average teacher salary -.317 1.000 .025 .335 -.121 .000 .210 .000 .000 1040 1040 1040 1040 1040 total revenue per pupil .123 .025 1.000 -.580 .001 .000 .210 .000 .483 1040 1040 1040 1040 1040 average class size -.090 .335 -.580 1.000 -.119 .002 ,000 .000 .000 1040 1040 1040 1040 1040 percent econ. disadvantag. students .078 -.121 .001 -.119 1.000 .006 .000 .483 .000 1040 1040 1040 1040 1040 Model 1 Variables Entered/Removed Variables Entered percent econ. disadvantag. students, total revenue per pupil, average teacher salary, average class sizeb Variables Removed Method Enter a. Dependent Variable: teacher turnover rate b. All requested variables entered. Model Summary R Adjusted R Square Std. Error of the Estimate Model R Square 1 .369² .136 .133 8.3610 a. Predictors: (Constant), percent econ. disadvantag, students, total revenue per pupil, average teacher salary, average class size Model 1 Sum of Squares 11431.373 72353.725 83785.098 a. Dependent Variable: teacher turnover rate b. Predictors: (Constant), percent econ. disadvantag. students, total revenue per pupil, average teacher salary, average class size Model 1 ANOVA df Regression Residual Total 4 1035 1039 (Constant) average teacher salary total revenue per pupil average class size percent econ. disadvantag. students a. Dependent Variable: teacher turnover rate Mean Square 2857.843 69.907 Sig. F 40.881 .000 B Coefficients Unstandardized Coefficients 48.269 -.001 .001 .690 .025 Std. Error 3.858 .000 .000 .152 .013 Standardized Coefficients Beta Sig. 12.512.000 -.377 -11.747.000 .236 6.366 .000 4.546 .000 1.840 .066 t .179 .054 teacher turnover rate average teacher salary total revenue per pupil average class size Descriptive Statistics percent econ. disadvantag. students Mean 17.449 36570.46 7907.20 12.353 48.264 Std. Deviation 8.9800 2675.934 2944.828 2.3354 19.6104 N 1040 1040 1040 1040 1040 Pearson Correlation Sig. (1-tailed) N teacher turnover rate average teacher salary total revenue per pupil average class size percent econ. disadvantag. students teacher turnover rate average teacher salary total revenue per pupil average class size percent econ. disadvantag. students teacher turnover rate average teacher salary total revenue per pupil average class size percent econ. disadvantag. students Correlations teacher turnover rate 1.000 -317 .123 -.090 .078 .000 .000 .002 .006 1040 1040 1040 1040 1040 average teacher salary -.317 1.000 .025 .335 -.121 .000 .210 .000 .000 1040 1040 1040 1040 1040 total revenue per pupil .123 .025 1.000 -.580 .001 .000 .210 .000 .483 1040 1040 1040 1040 1040 average class size -.090 .335 -.580 1.000 -.119 .002 ,000 .000 .000 1040 1040 1040 1040 1040 percent econ. disadvantag. students .078 -.121 .001 -.119 1.000 .006 .000 .483 .000 1040 1040 1040 1040 1040 Model 1 Variables Entered/Removed Variables Entered percent econ. disadvantag. students, total revenue per pupil, average teacher salary, average class sizeb Variables Removed Method Enter a. Dependent Variable: teacher turnover rate b. All requested variables entered. Model Summary R Adjusted R Square Std. Error of the Estimate Model R Square 1 .369² .136 .133 8.3610 a. Predictors: (Constant), percent econ. disadvantag, students, total revenue per pupil, average teacher salary, average class size Model 1 Sum of Squares 11431.373 72353.725 83785.098 a. Dependent Variable: teacher turnover rate b. Predictors: (Constant), percent econ. disadvantag. students, total revenue per pupil, average teacher salary, average class size Model 1 ANOVA df Regression Residual Total 4 1035 1039 (Constant) average teacher salary total revenue per pupil average class size percent econ. disadvantag. students a. Dependent Variable: teacher turnover rate Mean Square 2857.843 69.907 Sig. F 40.881 .000 B Coefficients Unstandardized Coefficients 48.269 -.001 .001 .690 .025 Std. Error 3.858 .000 .000 .152 .013 Standardized Coefficients Beta Sig. 12.512.000 -.377 -11.747.000 .236 6.366 .000 4.546 .000 1.840 .066 t .179 .054
Expert Answer:
Regression equation will be Teacher turnover rate 48269 0001 average teacher salary 0001 total revenue per pupil 0690 average class size 0025 percent ... View the full answer
Elementary Statistics
ISBN: 978-0538733502
11th edition
Authors: Robert R. Johnson, Patricia J. Kuby
Students also viewed these organizational behavior questions
-
The Ajax Corporation has the following set of projects available to it: *Note: All projects have equal risk. Ajax can raise funds with the following marginal costs: First $250 million..............
-
The following set of 25 scores was randomly selected from a teachers class list. Let x be the pre-final average and y be the final examination score. (The final examination had a maximum of 75...
-
Use the following set of pressure-volume data to find the best possible virial constants (A1 and A2) for the equation of state shown below. R = 82.05 ml atm/gmol K and T = 303K. PV RT =I+ 1.108 1.363...
-
The data below are the calories and grams of sugar in some popular store bought cookies. Calories 143 Grams of Sugar 12 97 9 200 11 149 19 84 4 57 9 198 21
-
The T-beam shown in the figure has cross-sectional dimensions as follows: b = 220mm, t = 15mm, h = 300mm, and h1 = 275. The beam is subjected to a shear force V = 60kN. Determine the maximum shear...
-
Assume that female students' heights are normally distributed with a mean given by = 64.2 in and a standard deviation given by = 2.6 in. a. If one female student is randomly selected, find the...
-
A companys balance sheet appears as follows: Required: (a) If 10,000 of the ordinary shares were purchased at par, there being no new issue of shares for the purpose, show the journal entries to...
-
Illinois Soy Products (ISP) buys soybeans and processes them into other soy products. Each ton of soybeans that ISP purchases for $ 340 can be converted for an additional $ 190 into 575 pounds of soy...
-
July 1, dec 31 Jan 5, Jan 12, Jan 14, Jan 20, Jan 21, Jan 25, Jan 31 Jan 5, Jan 12, Jan 14, Jan 20, Jan 21, Jan 25, Jan 31 Use the date that are on the first slide. . Waterway Company borrows $40...
-
When buying or leasing a new car, one of the factors that customers consider is the type of fuel it uses. Some people prefer vehicles that use diesel fuel, while others favor vehicles that use...
-
A charged particle enters a region of space with a uniform magnetic field B = 1.82 T. At a particular instant in time, it has velocity v = (1.34 106 + 2.54 x 10⁶ ) m/s. Based on the observed...
-
4 pts. What is the induced magnetic field in Teslas around a loop of circumference 0.555 meters if the electric field is given by E = Eo(at) over the time interval required for the field to increase...
-
Explain contingent liabilities in your own words Give an example of a contingent liability that would be recorded in the financial statements. Give an example of a contingent liability that would...
-
The following information is provided for the first month of operations for Legal Services Inc.: Prepare a T-accounts to reflect the following business transaction: Legal Services Inc., was started...
-
What is the total current flowing through the series circuit pictured below? 3 A 4+ RI ww 10 V WWW. R3 6 V WwW.
-
Galaxy Sports Inc. manufactures and sells two styles of All Terrain Vehicles (ATVs), the Conquistador and Hurricane, from a single manufacturing facility. The manufacturing facility operates at 100%...
-
The controller of the Red Wing Corporation is in the process of preparing the company's 2021 financial statements. She is trying to determine the correct balance of cash and cash equivalents to be...
-
Rewrite Programming Exercise 7.5 using streams. Display the numbers in increasing order. Data from Programming Exercise 7.5 Write a program that reads in 10 numbers and displays the number of...
-
Question 3 (10 Points): Set theory and logics (02) - a) Identify the truth value of the proposition "For arbitrary sets A, B, C, D, (A B) (C D) = (A x C) (B x D)". Prove your claim. (5 Points) b) For...
-
The table here shows the average number of births per day in the United States as reported by the CDC (Centers for Disease Control). Based on this information, what is the probability that one baby...
-
A study in the Journal of Range Management examines the relationships between elements in Russian wild rye. The correlation coefficient between magnesium and calcium was reported to be 0.69 for a...
-
A scatter diagram is drawn showing the data for x and y, two normally distributed variables. The data fall within the intervals 20 x 40 and 60 y 100 Where would you expect to find the data on the...
-
U.S. Industries has a subsidiary in Switzerland. The subsidiary's financial statements are maintained in Swiss francs (CHF). Exchange rates (\($/CHF)\) for selected dates are as follows: The...
-
Asda is a British supermarket chain owned by Wal-Mart Stores, Inc. Assume that the following data relate to Asda's activities for 2017 (in millions).. Exchange rates (\($/)\) during 2017 are:...
-
Massmart Holdings Ltd. is a South African subsidiary of Wal-Mart Inc., selling high volume, low margin branded consumer goods to customers in twelve countries in Africa. Massmart's accounts are...
Study smarter with the SolutionInn App