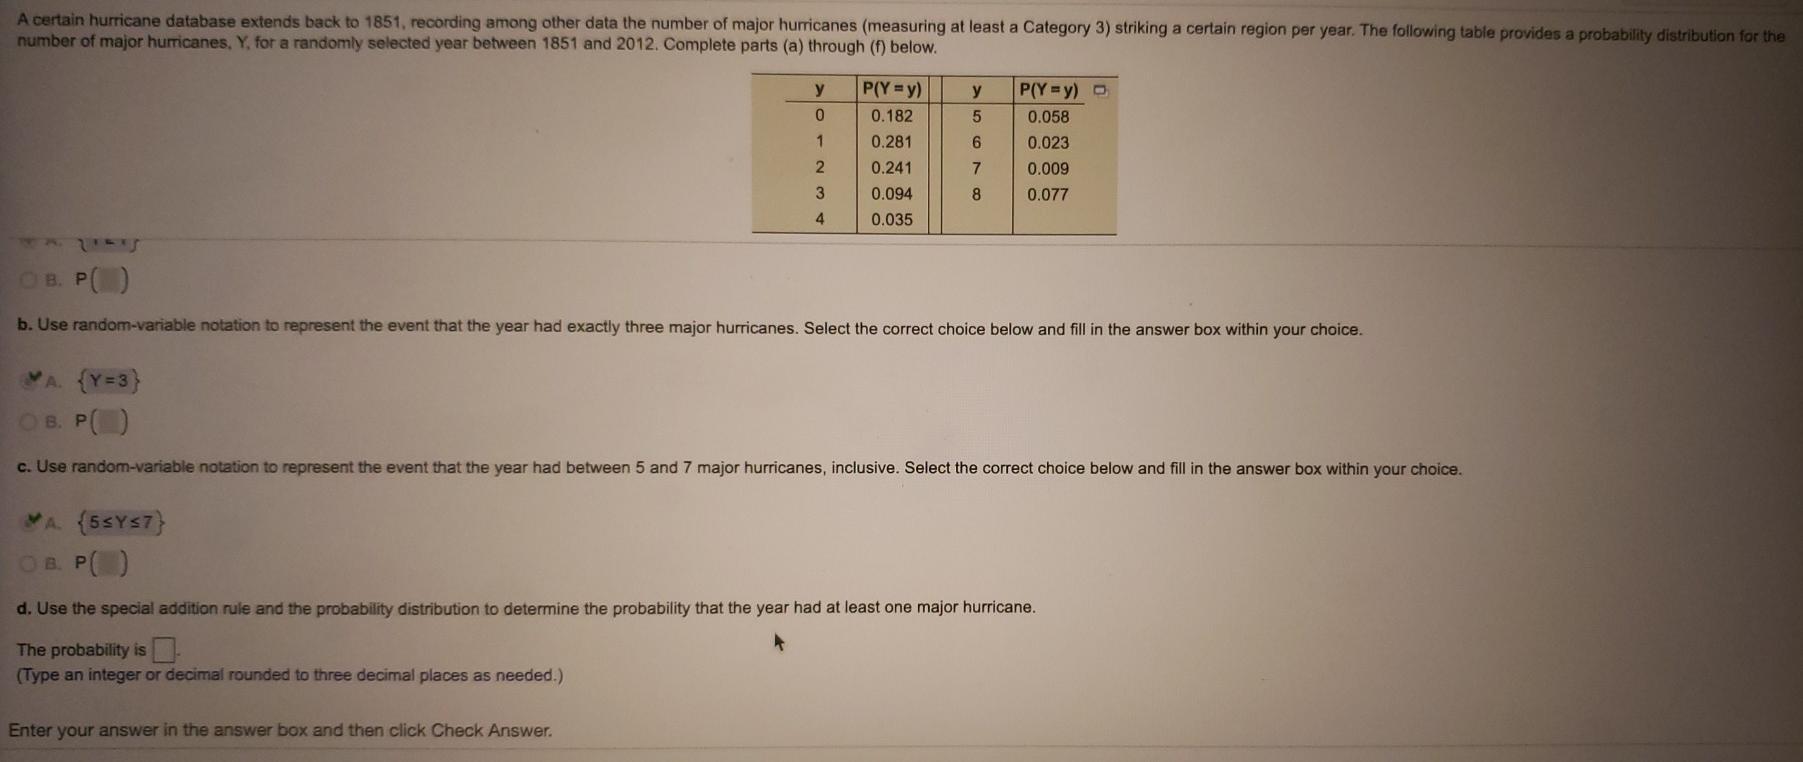
A certain hurricane database extends back to 1851, recording among other data the number of major...
Fantastic news! We've Found the answer you've been seeking!
Question:
Transcribed Image Text:
A certain hurricane database extends back to 1851, recording among other data the number of major huricanes (measuring at least a Category 3) striking a certain region per year. The following table provides a probability distribution for the number of major hurricanes, Y, for a randomly selected year between 1851 and 2012. Complete parts (a) through (f) below. y P(Y y) y P(Y = y) D 0.182 0.058 1 0.281 6. 0.023 0.241 7 0.009 0.094 8 0.077 4 0.035 TAUULS OB. P() b. Use random-variable notation to represent the event that the year had exactly three major hurricanes. Select the correct choice below and fill in the answer box within your choice. A. (Y=3} OB. P() c. Use random-variable notation to represent the event that the year had between 5 and 7 major hurricanes, inclusive. Select the correct choice below and fill in the answer box within your choice. A (5SYS7} OB. P() d. Use the special addition rule and the probability distribution to determine the probability that the year had at least one major hurricane. The probability is- (Type an integer or decimal rounded to three decimal places as needed.) Enter your answer in the answer box and then click Check Answer. A certain hurricane database extends back to 1851, recording among other data the number of major huricanes (measuring at least a Category 3) striking a certain region per year. The following table provides a probability distribution for the number of major hurricanes, Y, for a randomly selected year between 1851 and 2012. Complete parts (a) through (f) below. y P(Y y) y P(Y = y) D 0.182 0.058 1 0.281 6. 0.023 0.241 7 0.009 0.094 8 0.077 4 0.035 TAUULS OB. P() b. Use random-variable notation to represent the event that the year had exactly three major hurricanes. Select the correct choice below and fill in the answer box within your choice. A. (Y=3} OB. P() c. Use random-variable notation to represent the event that the year had between 5 and 7 major hurricanes, inclusive. Select the correct choice below and fill in the answer box within your choice. A (5SYS7} OB. P() d. Use the special addition rule and the probability distribution to determine the probability that the year had at least one major hurricane. The probability is- (Type an integer or decimal rounded to three decimal places as needed.) Enter your answer in the answer box and then click Check Answer.
Expert Answer:
Related Book For
Posted Date:
Students also viewed these mathematics questions
-
The following table provides a probability distribution for the random variable y. Y ................... f(y) 2 ..................... 20 4 .................... 30 7 ................... 40 8...
-
The random variable Y is the number of major hurricanes for a randomly selected year between 1851 and 2012. Its probability distribution is as follows. We have provided the probability distributions...
-
The following table provides a probability distribution for the random variable y . y f(y) 2 0.10 5 0.20 7 0.40 9 0.30 b. Compute and (to 2 decimals). Var(y)_____________ o__________________
-
John Hasty opened his bakery on March 1, 1999. The following transactions took place in early March: 1. Deposited $10,000 into a checking account in the name of the Hasty Bakery. 2. Leased a small...
-
The following data represent political party by age from a random sample of registered Iowa Voters. (a) Are the events Republican and 30-44 independent? Justify your answer. (b) Are the events...
-
Below is the Stockholders' Equity section of the balance sheet prepared as of the end of the current year. Prepare a corrected Stockholders' Equity section using Method 1 of Exhibit 7. Refer to the...
-
The chart below summarizes the U.S. exchange traded companies that issued corrections to their financial statements during the years 2001 through 2014. The data was compiled by Audit Analytics and...
-
A slit 0.360mm wide is illuminated by parallel rays of light that have a wavelength of 540nm. The diffraction pattern is observed on a screen that is 1.20 m from the alit. The intensity at the center...
-
jose wants to have money available for any future purchase he desires. waht is his BEST choice to assure that he has open-ended credit? a single lump-sum credit, an installment cash credit, an...
-
Donna Jamison was recently hired as a financial analyst by Computron Industries, a manufacturer of electronic components. Her first task was to conduct a financial analysis of the firm covering the...
-
Describe briefly the quark model of hadrons, including the properties of quarks.
-
Understand assurance services and attest services. What is quality control and what are the elements of quality control? What is peer review? What are some types of peer review? What is SOX and what...
-
1. Can you give examples of any successful OD programmes? Draw on recent research for your answer. 2. You have been asked to give a talk to a postgraduate management conference on The qualities...
-
1. Define and describe the value chain model. (4) 2. Define an information system and describe the activities it performs. (4) 3. Explain how enterprise applications improve organizational...
-
Often, within the United States, people tend to talk about supply chain management in healthcare without truly considering what those words mean. Supply chain management can directly impact costs,...
-
Mr. Ibrahim is a deputy sales director for a multinational company operating in the Arab region. He has just been told that his salesperson "Sami" has been stealing from the company by submitting...
-
The Superintendent of the Washoe County School District is being asked by the Nevada Department of Education to do a wage analysis of high school teachers. The average Washoe County high school...
-
Show that if A is any m n matrix, then Im A = A and AIn = A.
-
Use single-value grouping. a. Determine a frequency distribution. b. Obtain a relative-frequency distribution. c. Construct a frequency histogram based on your result from part (a). d. Construct a...
-
The U.S. Census Bureau publishes data on housing units in American Housing Survey for the United States. The following table provides a frequency distribution for the number of rooms in U.S. housing...
-
Use cutpoint grouping with a first class of 40-under 46. a. Determine a frequency distribution. b. Obtain a relative-frequency distribution. c. Construct a frequency histogram based on your result...
-
As long as human _________ exceed available _________, scarcity will exist.
-
The scarce resources that are used in the production of goods and services can be grouped into four categories: _________, _________, _________, and _________.
-
Well-defined property rights encourage a. investment. b. innovation. c. conservation. d. exchange. e. economic growth. f. all of the above.
Study smarter with the SolutionInn App