

A graph is a picture of ordered pairs of numbers. Thus, to draw a graph we...
Fantastic news! We've Found the answer you've been seeking!
Question:
Transcribed Image Text:
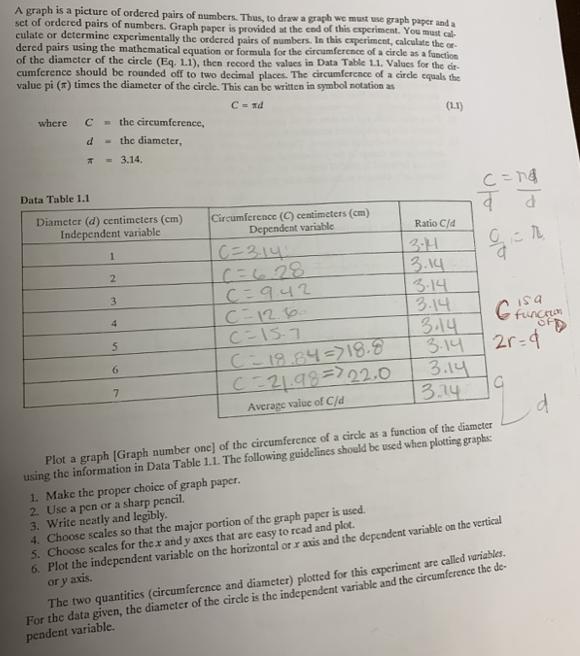
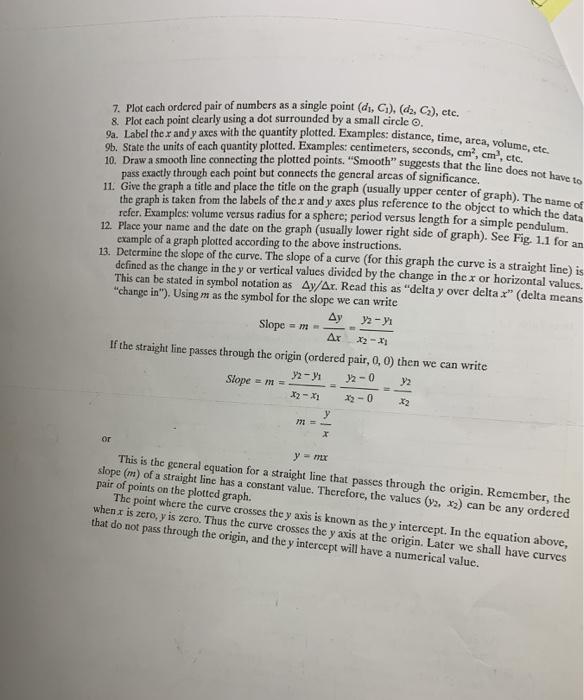
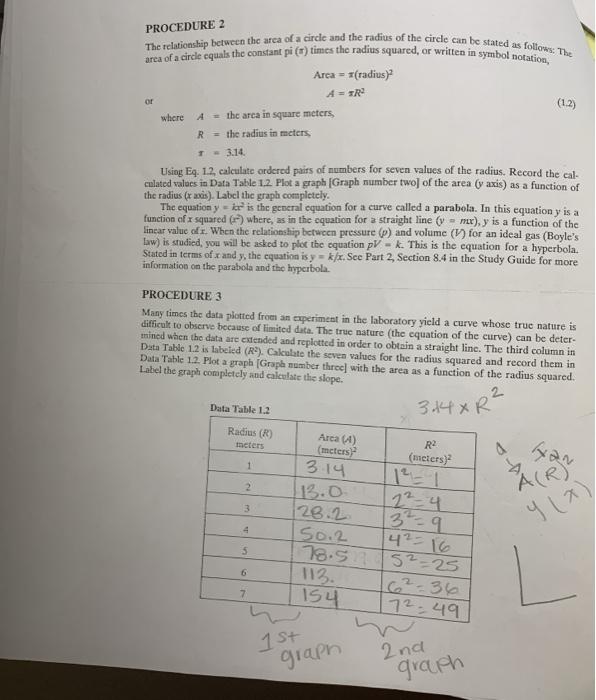
A graph is a picture of ordered pairs of numbers. Thus, to draw a graph we must use graph paper and a set of ordered pairs of numbers. Graph paper is provided at the end of this experiment. You must cal culate or determine experimentally the ordered pairs of numbers. In this experiment, calculate the or- dered pairs using the mathematical equation or formula for the circumference of a circle as a function of the diameter of the circle (Eq. 1.1), then record the values in Data Table 1.1. Values for the dir- cumference should be rounded off to two decimal places. The circumference of a circle equals the value pi (r) times the diameter of the circle. This can be written in symbol notation as C = nd (11) where C the circumference, d - the diameter, -3.14. म Data Table 1.1 Diameter (d) centimeters (cm) Independent variable 1 2 3 4 5 6 7 Circumference (C) centimeters (cm) Dependent variable C=314² C=628 C=942 C-125 C÷15-7 C=18.84-718.8 C=21.98=722.0 Average value of C/d Ratio C/d 1. Make the proper choice of graph paper. 2. Use a pen or a sharp pencil. 3. Write neatly and legibly. 3-11 3.14 3.14 3.14 3.14 3.14 3.14 3.14 c=14 व gel & fun Plot a graph (Graph number one] of the circumference of a circle as a function of the diameter using the information in Data Table 1.1. The following guidelines should be used when plotting graphs: 2r=4 G isa Funcru OFF 4. Choose scales so that the major portion of the graph paper is used. 5. Choose scales for the x and y axes that are easy to read and plot. 6. Plot the independent variable on the horizontal or r axis and the dependent variable on the vertical or y axis, The two quantities (circumference and diameter) plotted for this experiment are called variables. For the data given, the diameter of the circle is the independent variable and the circumference the de- pendent variable. d 7. Plot each ordered pair of numbers as a single point (d₁, C₁), (d2, C₂), etc. 8. Plot each point clearly using a dot surrounded by a small circle Ⓒ. 9a. Label the xr and y axes with the quantity plotted. Examples: distance, time, area, volume, etc. 10. Draw a smooth line connecting the plotted points. "Smooth" suggests that the line does not have to 9b. State the units of each quantity plotted. Examples: centimeters, seconds, cm², cm³, etc, pass exactly through each point but connects the general areas of significance. 11. Give the graph a title and place the title on the graph (usually upper center of graph). The name of the graph is taken from the labels of the x and y axes plus reference to the object to which the data refer. Examples: volume versus radius for a sphere; period versus length for a simple pendulum. 12. Place your name and the date on the graph (usually lower right side of graph). See Fig. 1.1 for an example of a graph plotted according to the above instructions. 13. Determine the slope of the curve. The slope of a curve (for this graph the curve is a straight line) is defined as the change in the y or vertical values divided by the change in the x or horizontal values. This can be stated in symbol notation as Ay/Ar. Read this as "delta y over delta .x" (delta means "change in"). Using m as the symbol for the slope we can write Ay y2-yi Slope Ar x2-x₂ If the straight line passes through the origin (ordered pair, 0, 0) then we can write 32-0 y2 X2-0 X2 Slope or = M = y2-y₁ X2-X1 y 771=- x 2 M y = mx This is the general equation for a straight line that passes through the origin. Remember, the slope (m) of a straight line has a constant value. Therefore, the values (V2. x2) can be any ordered pair of points on the plotted graph. The point where the curve crosses the y axis is known as the y intercept. In the equation above, when x is zero, y is zero. Thus the curve crosses the y axis at the origin. Later we shall have curves that do not pass through the origin, and they intercept will have a numerical value. PROCEDURE 2 The relationship between the area of a circle and the radius of the circle can be stated as follows: The area of a circle equals the constant pi (r) times the radius squared, or written in symbol notation, or where A= the arca in square meters, R the radius in meters, T -3.14. Using Eq: 1.2, calculate ordered pairs of numbers for seven values of the radius. Record the cal- culated values in Data Table 1.2. Plot a graph [Graph number two] of the area (y axis) as a function of the radius (r axis). Label the graph completely. The equation y - k is the general equation for a curve called a parabola. In this equation y is a function of x squared (²) where, as in the equation for a straight line (v mux), y is a function of the linear value of x. When the relationship between pressure (p) and volume (V) for an ideal gas (Boyle's law) is studied, you will be asked to plot the equation pl k. This is the equation for a hyperbola. Stated in terms of x and y, the equation is y= k/x. See Part 2, Section 8.4 in the Study Guide for more information on the parabola and the hyperbola. Data Table 1.2 Radius (R) meters 1 PROCEDURE 3 Many times the data plotted from an experiment in the laboratory yield a curve whose true nature is difficult to observe because of limited data. The true nature (the equation of the curve) can be deter- mined when the data are extended and replotted in order to obtain a straight line. The third column in Data Table 1.2 is labeled (R2). Calculate the seven values for the radius squared and record them in Data Table 1.2. Plot a graph (Graph number threel with the area as a function of the radius squared. Label the graph completely and calculate the slope. 2 2 3 Area = x(radius)² Á TRỊ 4 5 6 7 Area (4) (meters) 3.14 13.0 28.2 50.2 22=4 3²=9 4²=16 78.552=25 113. 154 314x R 1st graph R² (meters)² (1.2) 6²=36 72:49 2nd graph A(R)² y (x) QUESTIONS 1. Describe the method you used to determine the magnitude of the divisions for the x and y axes in order to plot a graph that uses the major portion of the graph paper. 2. Distinguish between dependent and independent variables. 3. Name the dependent and independent variables in Procedure 2. 4. How is the name for the graph selected? 5. How are the units for the slope determined? 6. What is the relationship between the units for the x and y axes and the units for the slope? 7. Is the relationship between the circumference and the diameter of a circle a linear relationship? Explain your answer. 8. What is the relationship between the slope of the curve in Procedure 1 and the ratio of C/d? 9. When the value for x increases faster than the values for y, which way (toward or away from) will the graph curve with respect to the y axis? 10. State in words the relationship between the area of a circle and the radius². A graph is a picture of ordered pairs of numbers. Thus, to draw a graph we must use graph paper and a set of ordered pairs of numbers. Graph paper is provided at the end of this experiment. You must cal culate or determine experimentally the ordered pairs of numbers. In this experiment, calculate the or- dered pairs using the mathematical equation or formula for the circumference of a circle as a function of the diameter of the circle (Eq. 1.1), then record the values in Data Table 1.1. Values for the dir- cumference should be rounded off to two decimal places. The circumference of a circle equals the value pi (r) times the diameter of the circle. This can be written in symbol notation as C = nd (11) where C the circumference, d - the diameter, -3.14. म Data Table 1.1 Diameter (d) centimeters (cm) Independent variable 1 2 3 4 5 6 7 Circumference (C) centimeters (cm) Dependent variable C=314² C=628 C=942 C-125 C÷15-7 C=18.84-718.8 C=21.98=722.0 Average value of C/d Ratio C/d 1. Make the proper choice of graph paper. 2. Use a pen or a sharp pencil. 3. Write neatly and legibly. 3-11 3.14 3.14 3.14 3.14 3.14 3.14 3.14 c=14 व gel & fun Plot a graph (Graph number one] of the circumference of a circle as a function of the diameter using the information in Data Table 1.1. The following guidelines should be used when plotting graphs: 2r=4 G isa Funcru OFF 4. Choose scales so that the major portion of the graph paper is used. 5. Choose scales for the x and y axes that are easy to read and plot. 6. Plot the independent variable on the horizontal or r axis and the dependent variable on the vertical or y axis, The two quantities (circumference and diameter) plotted for this experiment are called variables. For the data given, the diameter of the circle is the independent variable and the circumference the de- pendent variable. d 7. Plot each ordered pair of numbers as a single point (d₁, C₁), (d2, C₂), etc. 8. Plot each point clearly using a dot surrounded by a small circle Ⓒ. 9a. Label the xr and y axes with the quantity plotted. Examples: distance, time, area, volume, etc. 10. Draw a smooth line connecting the plotted points. "Smooth" suggests that the line does not have to 9b. State the units of each quantity plotted. Examples: centimeters, seconds, cm², cm³, etc, pass exactly through each point but connects the general areas of significance. 11. Give the graph a title and place the title on the graph (usually upper center of graph). The name of the graph is taken from the labels of the x and y axes plus reference to the object to which the data refer. Examples: volume versus radius for a sphere; period versus length for a simple pendulum. 12. Place your name and the date on the graph (usually lower right side of graph). See Fig. 1.1 for an example of a graph plotted according to the above instructions. 13. Determine the slope of the curve. The slope of a curve (for this graph the curve is a straight line) is defined as the change in the y or vertical values divided by the change in the x or horizontal values. This can be stated in symbol notation as Ay/Ar. Read this as "delta y over delta .x" (delta means "change in"). Using m as the symbol for the slope we can write Ay y2-yi Slope Ar x2-x₂ If the straight line passes through the origin (ordered pair, 0, 0) then we can write 32-0 y2 X2-0 X2 Slope or = M = y2-y₁ X2-X1 y 771=- x 2 M y = mx This is the general equation for a straight line that passes through the origin. Remember, the slope (m) of a straight line has a constant value. Therefore, the values (V2. x2) can be any ordered pair of points on the plotted graph. The point where the curve crosses the y axis is known as the y intercept. In the equation above, when x is zero, y is zero. Thus the curve crosses the y axis at the origin. Later we shall have curves that do not pass through the origin, and they intercept will have a numerical value. PROCEDURE 2 The relationship between the area of a circle and the radius of the circle can be stated as follows: The area of a circle equals the constant pi (r) times the radius squared, or written in symbol notation, or where A= the arca in square meters, R the radius in meters, T -3.14. Using Eq: 1.2, calculate ordered pairs of numbers for seven values of the radius. Record the cal- culated values in Data Table 1.2. Plot a graph [Graph number two] of the area (y axis) as a function of the radius (r axis). Label the graph completely. The equation y - k is the general equation for a curve called a parabola. In this equation y is a function of x squared (²) where, as in the equation for a straight line (v mux), y is a function of the linear value of x. When the relationship between pressure (p) and volume (V) for an ideal gas (Boyle's law) is studied, you will be asked to plot the equation pl k. This is the equation for a hyperbola. Stated in terms of x and y, the equation is y= k/x. See Part 2, Section 8.4 in the Study Guide for more information on the parabola and the hyperbola. Data Table 1.2 Radius (R) meters 1 PROCEDURE 3 Many times the data plotted from an experiment in the laboratory yield a curve whose true nature is difficult to observe because of limited data. The true nature (the equation of the curve) can be deter- mined when the data are extended and replotted in order to obtain a straight line. The third column in Data Table 1.2 is labeled (R2). Calculate the seven values for the radius squared and record them in Data Table 1.2. Plot a graph (Graph number threel with the area as a function of the radius squared. Label the graph completely and calculate the slope. 2 2 3 Area = x(radius)² Á TRỊ 4 5 6 7 Area (4) (meters) 3.14 13.0 28.2 50.2 22=4 3²=9 4²=16 78.552=25 113. 154 314x R 1st graph R² (meters)² (1.2) 6²=36 72:49 2nd graph A(R)² y (x) QUESTIONS 1. Describe the method you used to determine the magnitude of the divisions for the x and y axes in order to plot a graph that uses the major portion of the graph paper. 2. Distinguish between dependent and independent variables. 3. Name the dependent and independent variables in Procedure 2. 4. How is the name for the graph selected? 5. How are the units for the slope determined? 6. What is the relationship between the units for the x and y axes and the units for the slope? 7. Is the relationship between the circumference and the diameter of a circle a linear relationship? Explain your answer. 8. What is the relationship between the slope of the curve in Procedure 1 and the ratio of C/d? 9. When the value for x increases faster than the values for y, which way (toward or away from) will the graph curve with respect to the y axis? 10. State in words the relationship between the area of a circle and the radius².
Expert Answer:
Answer rating: 100% (QA)
Based on the information provided we have the following ordered pairs of numbers diamet... View the full answer

Related Book For 

Posted Date:
Students also viewed these physics questions
-
Using the format at the end of this exercise, indicate the impact that each of the following transactions has on the total net position of a proprietary fund and on each net position component. Also,...
-
The directed reading at the end of this chapter describes four tools for crises in projects. Might any of these be useful to Iceland in their planning?
-
The On the Job example at the end of this chapter provides a brief description of many training methods used in management development. To understand those methods better, the class breaks into teams...
-
Solve Prob. 410 using singularity functions. Use statics to determine the reactions. Prob. 410, The figure shows a cantilever consisting of steel angles size 100 Ã 100 Ã 12 mm mounted...
-
Dynamic viscosity of water (l0 -3 N s/m 2 ) is related to temperature T (C) in the following manner : (a) Plot this data. (b) Use interpolation to predict at T = 7.5C. (c) Use Polynomial...
-
The class Edevice describes the information about an electronic device with the following attributes: name (string), color(string), price (double) category (string) (The possible values are...
-
How should the leaving chief executive be involved in the succession planning and transition process?
-
1. Using the Big Five personality dimensions (see Chapter 3), diagnose Mulallys personality. How have these dimensions influenced his leadership at Ford? 2. What is Mulallys leadership style? What...
-
These types of procurement are very often high in monetary value but are generally purchased without modification or only slight modification. Generally purchased without modification or only slight...
-
Problem #12: Planning and Control Don't-Cha-Wanna-a-Coffee, a large-scale coffee company that has a chain of 125 retail coffee stores throughout New England, was embroiled in an ethics scandal 3...
-
The copper and bronze currency used by the Turkic Sultan of Delhi (India) Muhammad-bin-Tughluq during his brief existence from 1324 to 1351 has become a collector's item today. The supply of his...
-
1. What were the main strengths of the Soviet Union? What were the main weaknesses? Who exposed these weaknesses and to whom did he expose them? Was it economics or politics that led to the downfall...
-
Indigo Sdn. Bhd. (ISB) was founded in 1990. The company has more than 20 years of experience in the office furniture industry. ISB is one of the market leaders in the Malaysian furniture industry and...
-
Write a public instance (not static) method called testVal) in TestUtil.java that returns an int. This method must take a single String parameter. This method will possibly throw 3 Exceptions based...
-
In 1975, interest rates were 7.85% and the rate of inflation was 12.3% in the United States. What was the real interest rate in 1975? How would the purchasing power of your savings have changed over...
-
Mainline Produce Corporation acquired all the outstanding common stock of Iceberg Lettuce Corporation for $30,000,000 in cash. The book values and fair values of Iceberg's assets and liabilities were...
-
4.0 cm 24.0 cm 400 g 4.0 cm 300 g 300 g If the left weight were increased to 320 g, how far would the right weight move?
-
Tanaka Company's cost and production data for two recent months included the following: March April Production (units).........300................600 Rent.....................$1,800............$1,800...
-
For the regression equation obtained in Exercise 16.18, analyze the residuals by (a) Constructing a histogram, (b) Utilizing the normal probability plot, and (c) Plotting the residuals versus each of...
-
An air-compressor manufacturer purchases mechanical components from two different suppliers (MechSup = 1 or 2) and electrical/motor components from three different suppliers (ElectSup = 1, 2, or 3),...
-
A firm that specializes in preparing recent law school graduates for the state bar exam has formulated two alternatives to their current preparation course. To examine the relative effectiveness of...
-
Total quality management (TQM) is based on four tenets of (1) continuous improvement, (2) employee participation, (3) product/service improvement, and (4) supplier relationships. Review each of the...
-
Better Health Inc. is a health care provider which has clinics across the U.S. Indicate whether each of the following examples of benchmarking for Better Health is considered (1) internal...
-
The Malcolm Baidrige National Quality Award (Baldrige Award) requires applicants to demonstrate excellence in each of the following seven categories: (1) leadership; (2) strategic planning; (3)...

Study smarter with the SolutionInn App