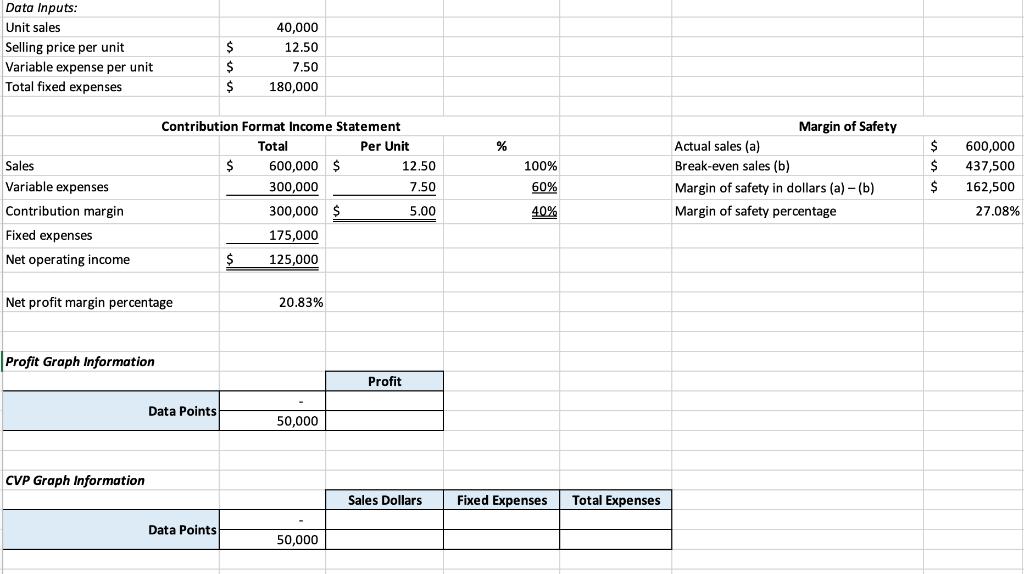
a. Prepare a profit graph for Donaldson Company. To prepare your graph, use sales volumes of...
Fantastic news! We've Found the answer you've been seeking!
Question:
Transcribed Image Text:
a. Prepare a profit graph for Donaldson Company. To prepare your graph, use sales volumes of zero units and 50,000 units as shown in cells B23 and B24. As a first step, create a formula in cell C23 that computes the profit when unit sales are zero. Your formula should reference data from the contribution format income statement provided in rows 4 through 18 of the worksheet. As a second step, copy your formula from cell C23 to cell C24. The profit (or loss) shown in cells C23 and C24 provide the two data points that you need to create a profit graph. b. Prepare a CVP graph for Donaldson Company. To prepare your graph, use sales volumes of zero units and 50,000 units as shown in cells B29 and B30. As a first step, create formulas in cells C29, D29, and E29 that compute the total sales dollars, total fixed expenses, and total expenses when unit sales are zero. Your formulas should reference data from the contribution format income statement provided in rows 4 through 18 of the worksheet. As a second step, copy your formulas from cells C29, D29, and E29, to cells C30, D30, and E30. The information shown in rows 29 and 30 provide the data points that you need to create a CVP graph. Data Inputs: Unit sales 40,000 Selling price per unit $ 12.50 Variable expense per unit 7.50 Total fixed expenses $ 180,000 Contribution Format Income Statement Margin of Safety Total Per Unit % Actual sales (a) $ 600,000 Sales $ 600,000 $ 12.50 100% Break-even sales (b) $ 437,500 Variable expenses 300,000 7.50 60% Margin of safety in dollars (a) – (b) $ 162,500 Contribution margin 300,000 $ 5.00 40% Margin of safety percentage 27.08% Fixed expenses 175,000 Net operating income $ 125,000 Net profit margin percentage 20.83% Profit Graph Information Profit Data Points 50,000 CVP Graph Information Sales Dollars Fixed Expenses Total Expenses Data Points 50,000 a. Prepare a profit graph for Donaldson Company. To prepare your graph, use sales volumes of zero units and 50,000 units as shown in cells B23 and B24. As a first step, create a formula in cell C23 that computes the profit when unit sales are zero. Your formula should reference data from the contribution format income statement provided in rows 4 through 18 of the worksheet. As a second step, copy your formula from cell C23 to cell C24. The profit (or loss) shown in cells C23 and C24 provide the two data points that you need to create a profit graph. b. Prepare a CVP graph for Donaldson Company. To prepare your graph, use sales volumes of zero units and 50,000 units as shown in cells B29 and B30. As a first step, create formulas in cells C29, D29, and E29 that compute the total sales dollars, total fixed expenses, and total expenses when unit sales are zero. Your formulas should reference data from the contribution format income statement provided in rows 4 through 18 of the worksheet. As a second step, copy your formulas from cells C29, D29, and E29, to cells C30, D30, and E30. The information shown in rows 29 and 30 provide the data points that you need to create a CVP graph. Data Inputs: Unit sales 40,000 Selling price per unit $ 12.50 Variable expense per unit 7.50 Total fixed expenses $ 180,000 Contribution Format Income Statement Margin of Safety Total Per Unit % Actual sales (a) $ 600,000 Sales $ 600,000 $ 12.50 100% Break-even sales (b) $ 437,500 Variable expenses 300,000 7.50 60% Margin of safety in dollars (a) – (b) $ 162,500 Contribution margin 300,000 $ 5.00 40% Margin of safety percentage 27.08% Fixed expenses 175,000 Net operating income $ 125,000 Net profit margin percentage 20.83% Profit Graph Information Profit Data Points 50,000 CVP Graph Information Sales Dollars Fixed Expenses Total Expenses Data Points 50,000
Expert Answer:
Related Book For
Advanced Accounting
ISBN: 978-0538480284
11th edition
Authors: Paul M. Fischer, William J. Tayler, Rita H. Cheng
Posted Date:
Students also viewed these accounting questions
-
Selling price per unit $750 Variable cost per unit $450 Annual fixed cost $180,000 Net income after tax $360,000 Tax rate 25% 1)Reduce the selling price by $60. The sales team forecast that with a...
-
Selling price = $15 per unit Variable costs - variable manufacturing costs = $5 per unit variable selling costs = $2 per unit Fixed costs - Fixed manufacturing costs = 4 per unit Fixed selling costs...
-
Liberals and Realists present different views on the impact of economic interdependence on the likelihood of security conflict. Which view do you think is more reasonable and why?
-
Discuss the different sampling procedures and techniques that you will apply to the qualitative and quantitative phases of the study.
-
Using Table 8.5, looking at the open, high, and low prices on the June futures contract, what can you tell about the trend of futures prices on this contract during the day?
-
The adjusted trial balance for Madrasah SE (in euros) is presented in the following worksheet for the month ended April 30, 2022. Instructions Complete the worksheet and prepare a classified...
-
\(11 \times 38\) Use clock arithmetic \((\bmod 12)\), to perform the indicated calculation.
-
The Lubricant is an expensive oil newsletter to which many oil giants subscribe, including Ken Brown (see Problem 3-17 for details). In the last issue, the letter described how the demand for oil...
-
Suppose that the index model for stocks A and B is estimated from excess returns with the following: Ra= 3%+1 Rm+eA, \(\sigma_M=0.20\\), RSQ-A= What is standard deviation of stock A? Please round to...
-
1. Do you think that Hello Kitty will continue to rule the world? What are the pros and cons? 2. What are the reasons that Hello Kitty is licensed to so many different product manufacturers? 3....
-
A complete listing of all activities identified and used in the ABC analysis is Blank______. Multiple choice question. activity costing an activity dictionary a bill of activities an activity cost...
-
Solve the given equation. 0.3x=6+2 The solution(s) is (are) x = 0, (Round to three decimal places as needed. Use a comma to separate answers as needed.)
-
A conical paper cup is 20 inches tall with a radius of 10 inches. The bottom of the cup is punctured so that the water leaks out at a rate of (2pi) / 3 cubic inches per second. At what rate is the...
-
Calculate the value of a firm through the use of discounted cash flow analysis. Problems: 1. Complete problem: Yield to Maturity for Annual Payments XYZ Corporation's bonds have 14 years remaining...
-
Neeley Grocery has a monthly target operating income of $20,700. Variable expenses are 10% of sales and monthly feed expenses are $15,300. What is the monthly margin of safety as a percentage of...
-
Given the following information: Average return Standard Deviation Stock X (w-40%) Stock Y (w-60%) 8% 20% 25% 22% Assume the correlation between the two stocks is 0.5. What's the portfolio's risk?
-
Now, At Gamma Company, the following errors were discovered after the transactions had been journalized and posted. Prepare the necessary correcting entry for each of the following, and explain what...
-
Use integration by parts to evaluate the following. Check your answer by taking the derivative. x2e-xdx
-
For the following transactions, prepare the entries that would be recorded in the general fixed assets account group for the city of Evert. a. The city purchased property costing $1,300,000, with...
-
On January 1, 2011, 100% of the outstanding stock of Sand Company was purchased by Plant Corporation for $3,200,000. At that time, the book value of Sands net assets equaled $3,000,000. The excess...
-
Peninsula Company owns an 80% controlling interest in Sandbar Company. Sandbar regularly sells merchandise to Peninsula, which then sells to outside parties. The gross profit on all such sales is...
-
Which of the below assertions is inaccurate concerning analytical procedures? (a) Analytical procedures involve evaluations of financial information through analysis of plausible relationships among...
-
Audit procedures can be classified into the following categories, except: (a) Risk assessment procedures (b) Tests of controls (c) Substantive procedures (d) Substantive analytical procedures (e)...
-
The main assertions in the financial statements relating to inventory, for which audit procedures should be designed and performed are: (a) Existence (b) Ownership (c) Completeness (d) Valuation
Study smarter with the SolutionInn App