

Calculate the nominal and real annual rate of housing price appreciation rate for Miami and for Houston
Fantastic news! We've Found the answer you've been seeking!
Question:
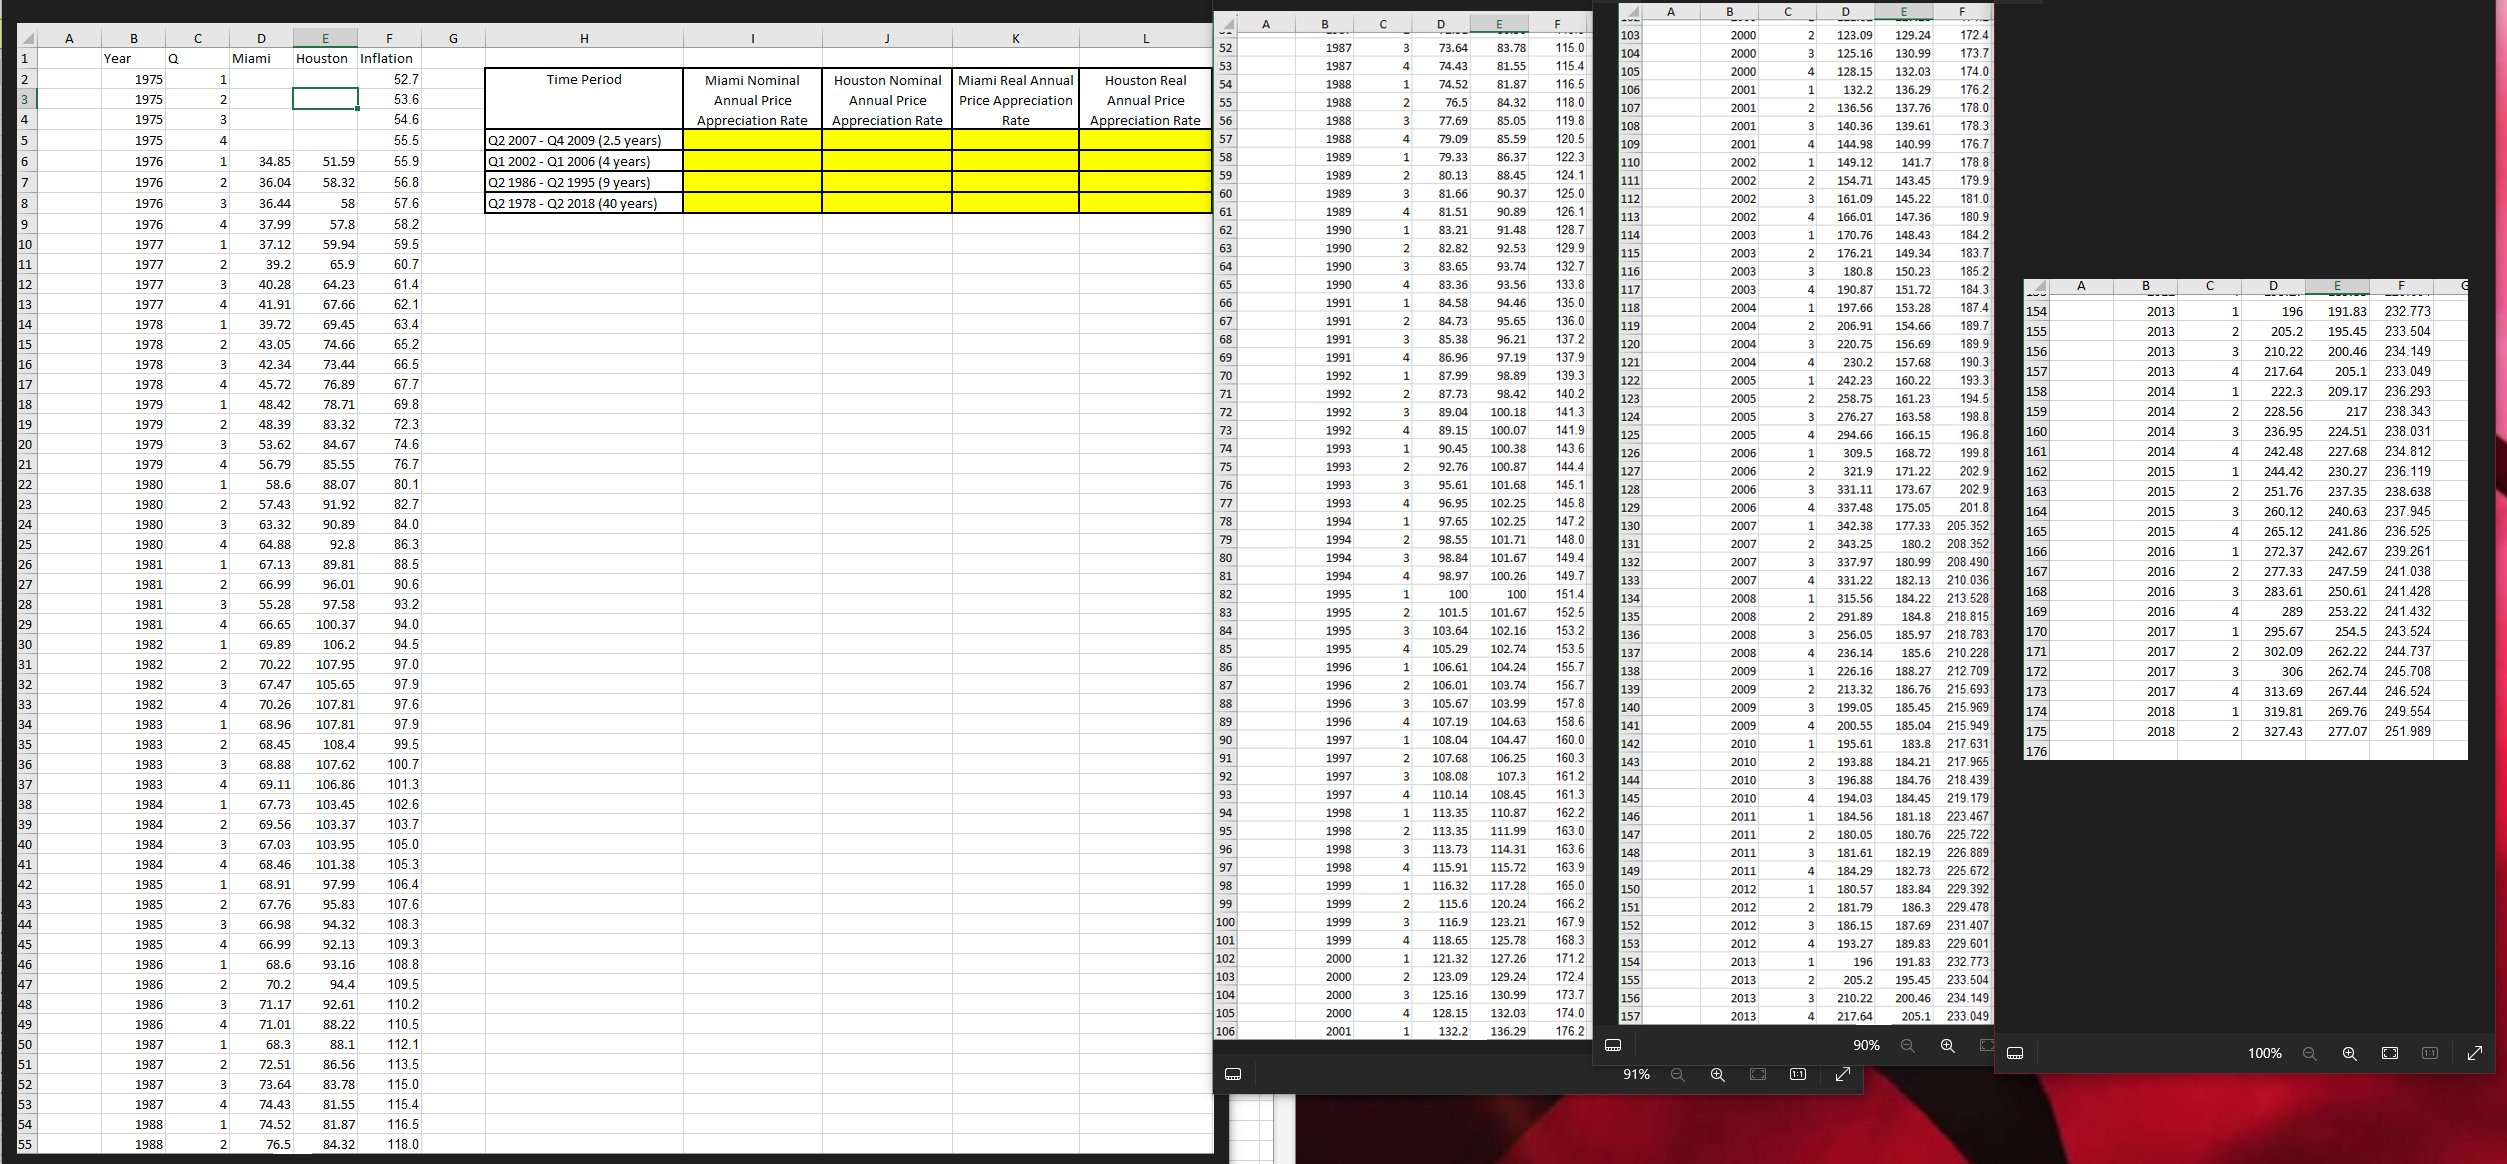
Calculate the nominal and real annual rate of housing price appreciation rate for Miami and for Houston for the requested different time periods using the housing price index data and the inflation index data provided to you in tab A ?of the Excel spreadsheet.
a ?In total, you need to calculate ?values that will appear in the ?yellow cells of that Excel tab.
bWhat can you say about the magnitude and the volatility of housing price appreciation in the short, medium and long run?
Transcribed Image Text:
A B D E F 4 A B D 103 2000 2 123.09 129.24 172.4 2 1 A Year B 1975 Q C Miami D F G H 52 1987 3 73.64 83.78 115.0 104 2000 3 125.16 130.99 173.7 Houston Inflation 53 1987 4 74.43 81.55 115.4 105 2000 4 128.15 132.03 174.0 1 52.7 Time Period Miami Nominal 3 1975 2 53.6 4 1975 3 54.6 Annual Price Appreciation Rate Houston Nominal Annual Price Appreciation Rate Miami Real Annual Price Appreciation Rate Houston Real 54 1988 1 74.52 81.87 116.5 106 2001 1 132.2 136.29 176.2 Annual Price 55 1988 2 76.5 84.32 118.0 107 2001 2 136.56 137.76 178.0 Appreciation Rate 56 1988 3 77.69 85.05 119.8 108 2001 3 140.36 139.61 178.3 5 1975 4 55.5 Q2 2007 Q4 2009 (2.5 years) 57 1988 4 79.09 85.59 120.5 109 2001 4 144.98 140.99 176.7 58 1989 1 79.33 86.37 122.3 6 1976 1 34.85 51.59 55.9 Q1 2002-Q1 2006 (4 years) 110 2002 1 149.12 141.7 178.8 59 1989 2 80.13 88.45 124.1 7 1976 2 36.04 58.32 56.8 Q2 1986 Q2 1995 (9 years) 111 2002 2 154.71 143.45 179.9 60 1989 3 81.66 90.37 125.0 112 2002 3 161.09 145.22 181.0 8 1976 3 36.44 58 57.6 Q2 1978 Q2 2018 (40 years) 61 1989 4 81.51 90.89 126.1 113 2002 4 166.01 147.36 180.9 9 1976 4 37.99 57.8 58.2 62 1990 1 83.21 91.48 128.7 114 2003 1 170.76 148.43 184.2 10 1977 1 37.12 59.94 59.5 63 1990 2 82.82 92.53 129.9 115 2003 2 176.21 149.34 183.7 11 1977 2 39.2 65.9 60.7 64 1990 3 83.65 93.74 132.7 116 2003 3 180.8 150.23 185.2 12 1977 3 40.28 64.23 61.4 65 1990 4 83.36 93.56 133.8 117 2003 4 190.87 151.72 184.3 A B C D 13 1977 4 41.91 67.66 62.1 66 1991 1 84.58 94.46 135.0 118 2004 1 197.66 153.28 187.4 154 2013 1 196 191.83 232.773 67 1991 2 84.73 95.65 136.0 14 1978 1 39.72 69.45 63.4 119 2004 2 206.91 154.66 189.7 155 2013 2 205.2 195.45 233.504 68 1991 3 85.38 96.21 137.2 15 1978 2 43.05 120 2004 3 220.75 156.69 189.9 74.66 65.2 156 2013 3 210.22 200.46 234.149 69 1991 4 86.96 97.19 137.9 121 2004 4 230.2 157.68 190.3 16 1978 3 42.34 73.44 66.5 70 1992 1 87.99 98.89 139.3 157 2013 4 217.64 205.1 233.049 122 2005 1 242.23 160.22 193.3 17 1978 4 45.72 76.89 67.7 71 1992 2 87.73 98.42 140.2 158 2014 1 222.3 123 2005 2 258.75 161.23 194.5 18 1979 1 48.42 78.71 69.8 72 1992 3 89.04 100.18 141.3 159 2014 2 228.56 124 2005 3 276.27 163.58 198.8 19 1979 2 48.39 83.32 72.3 73 1992 4 89.15 100.07 141.9 125 2005 20 1979 3 53.62 84.67 74.6 74 1993 1 90.45 100.38 143.6 126 2006 4 1 294.66 166.15 196.8 160 2014 3 309.5 168.72 199.8 161 2014 4 242.48 21 1979 4 56.79 85.55 76.7 75 1993 2 92.76 100.87 144.4 127 2006 2 321.9 171.22 202.9 162 2015 1 22 1980 1 58.6 88.07 80.1 76 1993 3 95.61 101.68 145.1 128 2006 3 331.11 173.67 202.9 163 2015 23 1980 2 57.43 91.92 77 82.7 1993 4 96.95 102.25 145.8 129 2006 4 337.48 175.05 201.8 164 2015 78 1994 1 97.65 102.25 147.2 24 1980 3 63.32 90.89 84.0 130 2007 1 342.38 177.33 205.352 165 2015 4 79 1994 2 98.55 101.71 148.0 25 1980 4 64.88 92.8 86.3 131 2007 2 343.25 180.2 208.352 166 2016 236.293 217 238.343 224.51 236.95 227.68 234.812 244.42 230.27 236.119 2 251.76 237.35 238.638 3 260.12 240.63 237.945 265.12 241.86 236.525 1 272.37 242.67 239.261 209.17 238.031 80 1994 3 98.84 101.67 149.4 132 2007 3 337.97 180.99 208.490 26 1981 1 67.13 89.81 88.5 167 2016 81 1994 4 98.97 100.26 149.7 133 2007 4 331.22 182.13 210.036 27 1981 2 66.99 96.01 90.6 82 1995 1 100 100 151.4 168 2016 2 277.33 3 283.61 247.59 241.038 250.61 241.428 134 2008 1 315.56 28 1981 3 55.28 97.58 93.2 83 1995 2 101.5 101.67 152.5 135 2008 29 1981 4 66.65 100.37 94.0 84 1995 3 103.64 102.16 153.2 136 2008 2 291.89 3 256.05 30 1982 1 69.89 106.2 94.5 85 1995 4 105.29 102.74 153.5 137 2008 4 236.14 31 1982 2 70.22 107.95 97.0 86 1996 1 106.61 104.24 155.7 138 2009 1 226.16 32 1982 3 67.47 105.65 97.9 87 1996 2 106.01 103.74 156.7 139 2009 2 213.32 33 1982 4 70.26 107.81 97.6 88 1996 3 105.67 103.99 157.8 140 2009 3 199.05 184.22 213.528 218.815 184.8 218.783 185.97 185.6 210.228 188.27 212.709 186.76 215.693 185.45 215.969 169 170 171 172 2016 4 289 253.22 241.432 2017 1 295.67 254.5 243.524 2017 173 2017 2017 2 3 302.09 262.22 244.737 306 4 313.69 262.74 245.708 267.44 246.524 174 2018 1 319.81 269.76 249.554 89 1996 4 107.19 104.63 158.6 34 1983 1 68.96 107.81 97.9 141 2009 90 1997 1 108.04 104.47 160.0 142 2010 4 200.55 185.04 215.949 1 195.61 183.8 217.631 35 1983 2 68.45 108.4 99.5 175 176 2018 2 327.43 277.07 251.989 91 1997 2 107.68 106.25 160.3 143 2010 2 193.88 184.21 217.965 36 1983 3 68.88 107.62 100.7 92 1997 3 108.08 107.3 161.2 144 2010 3 37 1983 4 69.11 106.86 101.3 93 1997 4 110.14 108.45 161.3 145 2010 38 1984 1 67.73 103.45 102.6 94 1998 1 113.35 110.87 162.2 146 2011 39 1984 2 69.56 103.37 103.7 95 1998 2 113.35 111.99 163.0 147 2011 40 1984 3 67.03 103.95 105.0 96 1998 3 113.73 114.31 163.6 148 2011 3 41 1984 4 68.46 101.38 105.3 97 1998 4 115.91 115.72 163.9 149 2011 42 1985 1 68.91 97.99 106.4 98 1999 1 116.32 117.28 165.0 150 2012 43 1985 2 67.76 95.83 107.6 99 1999 2 115.6 120.24 166.2 151 2012 100 1999 3 116.9 123.21 167.9 44 1985 3 66.98 94.32 108.3 152 2012 196.88 184.76 218.439 4 194.03 184.45 219.179 1 184.56 181.18 223.467 2 180.05 181.61 182.19 226.889 4 184.29 182.73 225.672 1 180.57 183.84 229.392 186.3 229.478 2 181.79 3 186.15 187.69 231.407 180.76 225.722 101 1999 4 118.65 125.78 168.3 45 1985 4 66.99 153 2012 4 193.27 189.83 229.601 92.13 109.3 102 2000 1 121.32 127.26 171.2 154 2013 1 196 191.83 232.773 46 1986 1 68.6 93.16 108.8 103 2000 2 123.09 129.24 172.4 155 2013 2 47 1986 2 70.2 94.4 109.5 104 2000 3 125.16 130.99 173.7 156 2013 3 48 1986 3 71.17 92.61 110.2 105 2000 4 128.15 132.03 174.0 157 2013 49 1986 4 71.01 88.22 110.5 106 2001 1 132.2 136.29 176.2 50 1987 1 68.3 88.1 112.1 O 205.2 195.45 233.504 210.22 200.46 234.149 4 217.64 90% Q 205.1 233.049 100% + 1:1 51 1987 2 72.51 86.56 113.5 91% Q + [1:1] 52 1987 3 73.64 83.78 115.0 53 1987 4 74.43 81.55 115.4 54 1988 1 74.52 81.87 116.5 55 1988 2 76.5 84.32 118.0 A B D E F 4 A B D 103 2000 2 123.09 129.24 172.4 2 1 A Year B 1975 Q C Miami D F G H 52 1987 3 73.64 83.78 115.0 104 2000 3 125.16 130.99 173.7 Houston Inflation 53 1987 4 74.43 81.55 115.4 105 2000 4 128.15 132.03 174.0 1 52.7 Time Period Miami Nominal 3 1975 2 53.6 4 1975 3 54.6 Annual Price Appreciation Rate Houston Nominal Annual Price Appreciation Rate Miami Real Annual Price Appreciation Rate Houston Real 54 1988 1 74.52 81.87 116.5 106 2001 1 132.2 136.29 176.2 Annual Price 55 1988 2 76.5 84.32 118.0 107 2001 2 136.56 137.76 178.0 Appreciation Rate 56 1988 3 77.69 85.05 119.8 108 2001 3 140.36 139.61 178.3 5 1975 4 55.5 Q2 2007 Q4 2009 (2.5 years) 57 1988 4 79.09 85.59 120.5 109 2001 4 144.98 140.99 176.7 58 1989 1 79.33 86.37 122.3 6 1976 1 34.85 51.59 55.9 Q1 2002-Q1 2006 (4 years) 110 2002 1 149.12 141.7 178.8 59 1989 2 80.13 88.45 124.1 7 1976 2 36.04 58.32 56.8 Q2 1986 Q2 1995 (9 years) 111 2002 2 154.71 143.45 179.9 60 1989 3 81.66 90.37 125.0 112 2002 3 161.09 145.22 181.0 8 1976 3 36.44 58 57.6 Q2 1978 Q2 2018 (40 years) 61 1989 4 81.51 90.89 126.1 113 2002 4 166.01 147.36 180.9 9 1976 4 37.99 57.8 58.2 62 1990 1 83.21 91.48 128.7 114 2003 1 170.76 148.43 184.2 10 1977 1 37.12 59.94 59.5 63 1990 2 82.82 92.53 129.9 115 2003 2 176.21 149.34 183.7 11 1977 2 39.2 65.9 60.7 64 1990 3 83.65 93.74 132.7 116 2003 3 180.8 150.23 185.2 12 1977 3 40.28 64.23 61.4 65 1990 4 83.36 93.56 133.8 117 2003 4 190.87 151.72 184.3 A B C D 13 1977 4 41.91 67.66 62.1 66 1991 1 84.58 94.46 135.0 118 2004 1 197.66 153.28 187.4 154 2013 1 196 191.83 232.773 67 1991 2 84.73 95.65 136.0 14 1978 1 39.72 69.45 63.4 119 2004 2 206.91 154.66 189.7 155 2013 2 205.2 195.45 233.504 68 1991 3 85.38 96.21 137.2 15 1978 2 43.05 120 2004 3 220.75 156.69 189.9 74.66 65.2 156 2013 3 210.22 200.46 234.149 69 1991 4 86.96 97.19 137.9 121 2004 4 230.2 157.68 190.3 16 1978 3 42.34 73.44 66.5 70 1992 1 87.99 98.89 139.3 157 2013 4 217.64 205.1 233.049 122 2005 1 242.23 160.22 193.3 17 1978 4 45.72 76.89 67.7 71 1992 2 87.73 98.42 140.2 158 2014 1 222.3 123 2005 2 258.75 161.23 194.5 18 1979 1 48.42 78.71 69.8 72 1992 3 89.04 100.18 141.3 159 2014 2 228.56 124 2005 3 276.27 163.58 198.8 19 1979 2 48.39 83.32 72.3 73 1992 4 89.15 100.07 141.9 125 2005 20 1979 3 53.62 84.67 74.6 74 1993 1 90.45 100.38 143.6 126 2006 4 1 294.66 166.15 196.8 160 2014 3 309.5 168.72 199.8 161 2014 4 242.48 21 1979 4 56.79 85.55 76.7 75 1993 2 92.76 100.87 144.4 127 2006 2 321.9 171.22 202.9 162 2015 1 22 1980 1 58.6 88.07 80.1 76 1993 3 95.61 101.68 145.1 128 2006 3 331.11 173.67 202.9 163 2015 23 1980 2 57.43 91.92 77 82.7 1993 4 96.95 102.25 145.8 129 2006 4 337.48 175.05 201.8 164 2015 78 1994 1 97.65 102.25 147.2 24 1980 3 63.32 90.89 84.0 130 2007 1 342.38 177.33 205.352 165 2015 4 79 1994 2 98.55 101.71 148.0 25 1980 4 64.88 92.8 86.3 131 2007 2 343.25 180.2 208.352 166 2016 236.293 217 238.343 224.51 236.95 227.68 234.812 244.42 230.27 236.119 2 251.76 237.35 238.638 3 260.12 240.63 237.945 265.12 241.86 236.525 1 272.37 242.67 239.261 209.17 238.031 80 1994 3 98.84 101.67 149.4 132 2007 3 337.97 180.99 208.490 26 1981 1 67.13 89.81 88.5 167 2016 81 1994 4 98.97 100.26 149.7 133 2007 4 331.22 182.13 210.036 27 1981 2 66.99 96.01 90.6 82 1995 1 100 100 151.4 168 2016 2 277.33 3 283.61 247.59 241.038 250.61 241.428 134 2008 1 315.56 28 1981 3 55.28 97.58 93.2 83 1995 2 101.5 101.67 152.5 135 2008 29 1981 4 66.65 100.37 94.0 84 1995 3 103.64 102.16 153.2 136 2008 2 291.89 3 256.05 30 1982 1 69.89 106.2 94.5 85 1995 4 105.29 102.74 153.5 137 2008 4 236.14 31 1982 2 70.22 107.95 97.0 86 1996 1 106.61 104.24 155.7 138 2009 1 226.16 32 1982 3 67.47 105.65 97.9 87 1996 2 106.01 103.74 156.7 139 2009 2 213.32 33 1982 4 70.26 107.81 97.6 88 1996 3 105.67 103.99 157.8 140 2009 3 199.05 184.22 213.528 218.815 184.8 218.783 185.97 185.6 210.228 188.27 212.709 186.76 215.693 185.45 215.969 169 170 171 172 2016 4 289 253.22 241.432 2017 1 295.67 254.5 243.524 2017 173 2017 2017 2 3 302.09 262.22 244.737 306 4 313.69 262.74 245.708 267.44 246.524 174 2018 1 319.81 269.76 249.554 89 1996 4 107.19 104.63 158.6 34 1983 1 68.96 107.81 97.9 141 2009 90 1997 1 108.04 104.47 160.0 142 2010 4 200.55 185.04 215.949 1 195.61 183.8 217.631 35 1983 2 68.45 108.4 99.5 175 176 2018 2 327.43 277.07 251.989 91 1997 2 107.68 106.25 160.3 143 2010 2 193.88 184.21 217.965 36 1983 3 68.88 107.62 100.7 92 1997 3 108.08 107.3 161.2 144 2010 3 37 1983 4 69.11 106.86 101.3 93 1997 4 110.14 108.45 161.3 145 2010 38 1984 1 67.73 103.45 102.6 94 1998 1 113.35 110.87 162.2 146 2011 39 1984 2 69.56 103.37 103.7 95 1998 2 113.35 111.99 163.0 147 2011 40 1984 3 67.03 103.95 105.0 96 1998 3 113.73 114.31 163.6 148 2011 3 41 1984 4 68.46 101.38 105.3 97 1998 4 115.91 115.72 163.9 149 2011 42 1985 1 68.91 97.99 106.4 98 1999 1 116.32 117.28 165.0 150 2012 43 1985 2 67.76 95.83 107.6 99 1999 2 115.6 120.24 166.2 151 2012 100 1999 3 116.9 123.21 167.9 44 1985 3 66.98 94.32 108.3 152 2012 196.88 184.76 218.439 4 194.03 184.45 219.179 1 184.56 181.18 223.467 2 180.05 181.61 182.19 226.889 4 184.29 182.73 225.672 1 180.57 183.84 229.392 186.3 229.478 2 181.79 3 186.15 187.69 231.407 180.76 225.722 101 1999 4 118.65 125.78 168.3 45 1985 4 66.99 153 2012 4 193.27 189.83 229.601 92.13 109.3 102 2000 1 121.32 127.26 171.2 154 2013 1 196 191.83 232.773 46 1986 1 68.6 93.16 108.8 103 2000 2 123.09 129.24 172.4 155 2013 2 47 1986 2 70.2 94.4 109.5 104 2000 3 125.16 130.99 173.7 156 2013 3 48 1986 3 71.17 92.61 110.2 105 2000 4 128.15 132.03 174.0 157 2013 49 1986 4 71.01 88.22 110.5 106 2001 1 132.2 136.29 176.2 50 1987 1 68.3 88.1 112.1 O 205.2 195.45 233.504 210.22 200.46 234.149 4 217.64 90% Q 205.1 233.049 100% + 1:1 51 1987 2 72.51 86.56 113.5 91% Q + [1:1] 52 1987 3 73.64 83.78 115.0 53 1987 4 74.43 81.55 115.4 54 1988 1 74.52 81.87 116.5 55 1988 2 76.5 84.32 118.0
Expert Answer:

Related Book For 

The Economics Of Money Banking And Financial Markets
ISBN: 9780321584717
4th Canadian Edition
Authors: Frederic S. Mishkin, Apostolos Serletis
Posted Date:
Students also viewed these finance questions
-
Shocker Electronics is a new company that distributes computer equipment to retail outlets. The following information pertains to Shocker Electronics during their first month of operations: Suppliers...
-
Question: Old MathJax webview Old MathJax webview i need ans of these question but the source is alot Old MathJax webviewOld MathJax webview i need ans of these question but the source is alot these...
-
What theoretical relationship should there be between the standard deviation in Problem 6.48 and the standard deviation in Problem 6.49? Table 6.2: Sample of birth-weights (oz) obtained from 1000...
-
Margaret Magee has served both as an outside director to Maxcor Manufacturing since 2007 and as a member of the companys compensation committee since 2011. Margaret has been reviewing Maxcors 2014...
-
During 2014, Damon Company had the following transactions: 1. Purchased $200,000 of 10-year bonds issued by Gallant, Inc. 2. Purchased common stock in Morceau Company, as a long-term investment, for...
-
For the sake of logic and coherence, Sentence 5 should abe placed: F. NO CHANGE G. Was being H. Could of been J. Was
-
Use your calculator to calculate \(19+(-36)\). Explain how the answer agrees with what was expected.
-
I think we goofed when we hired that new assistant controller,? said Ruth Scarpino, president of Provost Industries. ?Just look at this report that he prepared for last month for the Finishing...
-
You have been appointed the external auditor of BOA Ltd. On 16 March 2019, you were advised by management that one of BOA's debtors had been liquidated. The debtor in question had had its business...
-
12 Mitchell's Specialties sells high-end furniture (dressers, chairs, sofas, and tables). The company has been in business for several years. Based on its experience, management projects next year's...
-
A bond dealer buys a $10 million bond (face value) at an invoice price of 101.75. He finances that purchase with an overnight repo at a quoted rate of 1.30%. The haircut is 50 basis points. How much...
-
1. What is an information security standard for organizations that handle credit cards? A. International Organization for Standardization and International Electrotechnical Commission (ISO/IEC)...
-
The member below is composed of a tubular cylinder of stainless steel rigidly joined to a solid cylinder of carbon steel, one end of which is rigidly fixed to a wall. The composite member is...
-
The nonreflective coating on a camera lens with an index of refraction of 1.29 is designed to minimize the reflection of 621-nm light. If the lens glass has an index of refraction of 1.53, what is...
-
TER Evaluate the following exponents: a) 2-3 b) 8 2 c) (-8) d) ax.ay.az
-
A thread must have a uniform thickness of 0.650 mm. To check the thickness of the thread, you can illuminate it with a laser of wavelength 496.5 nm. A diffraction pattern like the one produced by a...
-
a. Assume you are a potential investor in Ghana and based on your analysis of the Ghanaian financial market, you are expecting interest rate to rise in the long term. How will this expectation...
-
Suppose that the laptop of Prob. 2.16 is placed in an insulating briefcase with a fully charged battery, but it does not go into sleep mode, and the battery discharges as if the laptop were in use....
-
We have discussed various stock markets in detail throughout this text. Another market that is less well known is the TSX Venture Exchange. Here contracts on a wide variety of commodities are traded...
-
If the point describing the combination of interest rate and aggregate output is not on either the IS or the LM curve, the economy will have no tendency to head toward the intersection of the...
-
What are the financial implications of a firm with a high default risk?
-
Which of the following assertions is accurate concerning the IAASB? (a) The International Auditing and Assurance Standards Board (IAASB) is an independent standard-setting body that serves the public...
-
Which of the following is accurate concerning the IAASB due process? (a) The IAASB follows a rigorous due process in developing its pronouncement (b) Input is obtained from a wide range of...
-
What methods can be used for selecting and evaluating information systems projects and aligning them with the firms business goals? Name and describe the groups responsible for the management of...

Study smarter with the SolutionInn App