

For every year in the sample, calculate the Holding Period Return. Recall that the HPR reflects both
Question:
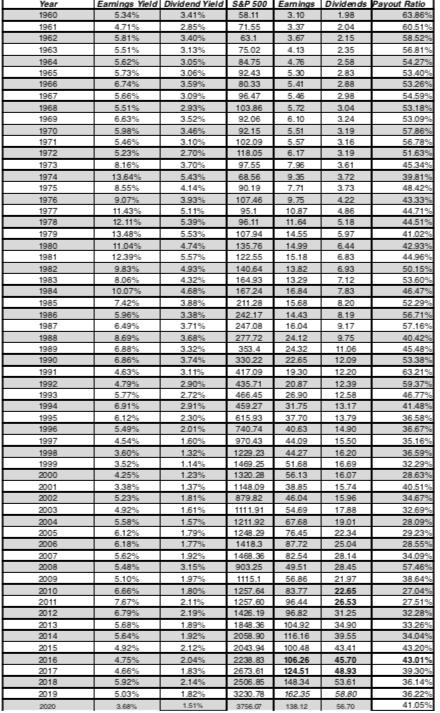
For every year in the sample, calculate the Holding Period Return. Recall that the HPR reflects both capital gains and dividend payments. For this calculation, assume the dividends are paid out at once at the end of the year.
a. What is your best estimate for next year's HPR?
b. What would have been the annual HPR if you invested in January 1960 and sold at the end of 2020?
c. Which year saw the lowest return? What happened?
d. Starting with an investment in the year after the lowest annual return on record, what would have been the total return over the subsequent 5 years?
e. What is the annual HPR for the 5-year investment starting the year after the lowest return year?
Expert Answer:
To calculate the Holding Period Return HPR for each year we can use the formula HPR Ending Value Dividends Beginning Value 1 Here are the calculations ... View the full answer


Income Tax Fundamentals 2013
ISBN: 9781285586618
31st Edition
Authors: Gerald E. Whittenburg, Martha Altus Buller, Steven L Gill
