Company: PG years: 2022, 2021, 2020 (unless it has to be starting 2021, 2020, 2019). problem: 1)
Question:
Company: PG
years: 2022, 2021, 2020 (unless it has to be starting 2021, 2020, 2019).
problem:
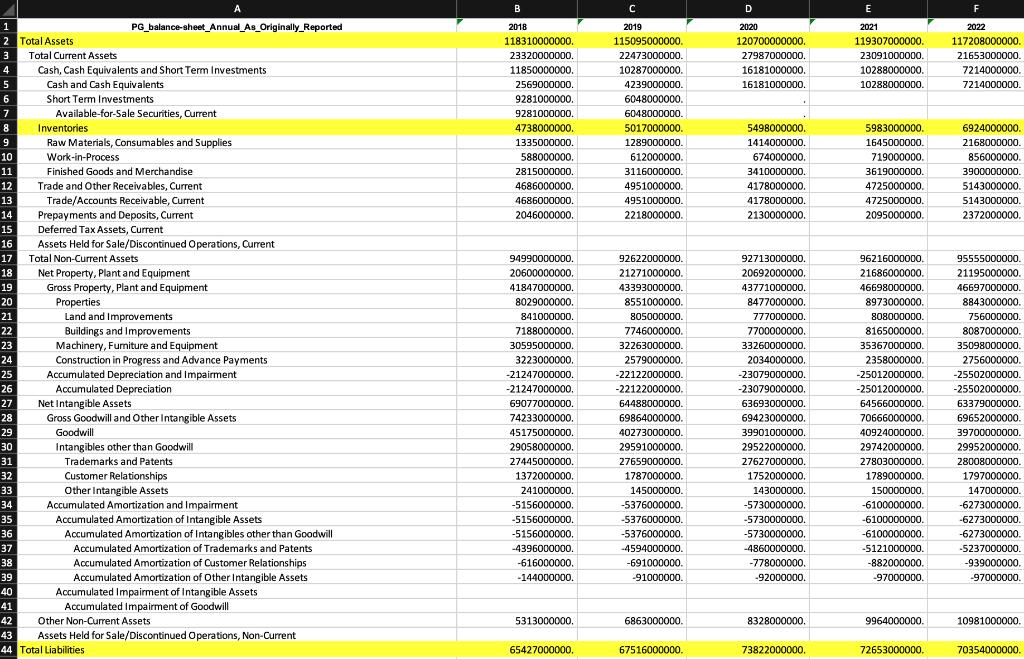
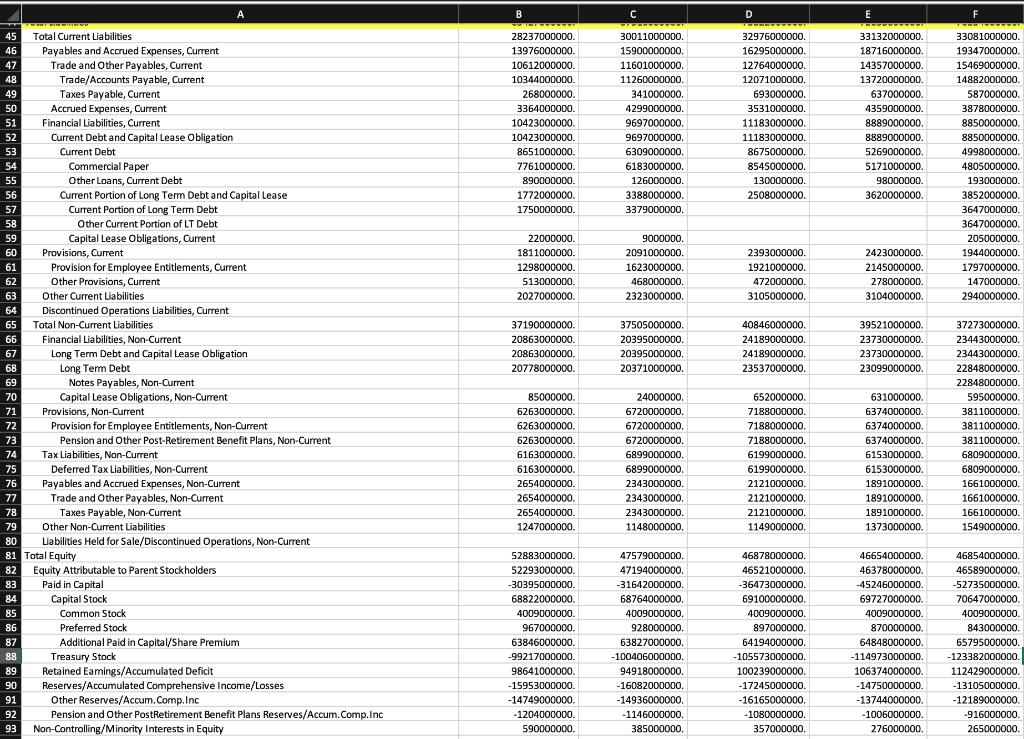
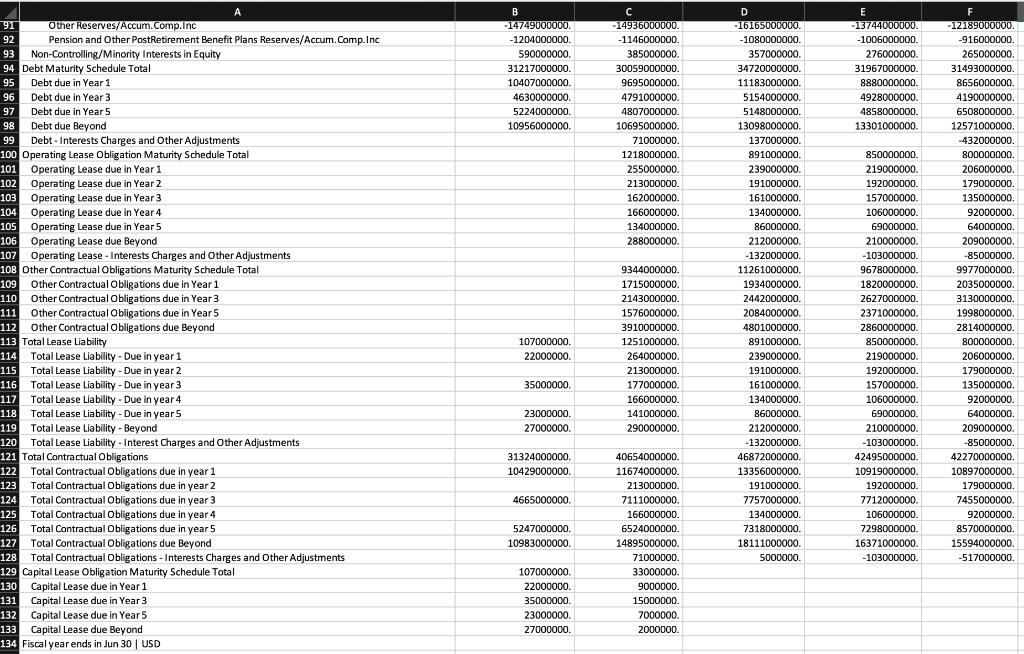
1) Using an Excel spreadsheet, you will create a three-year ratio trend analysis from the financial statements for your assigned corporation. The trend will consist of the following ratios:
Current Ratio and the Quick Ratio from the “I. Short term solvency, or liquidity, ratios” category
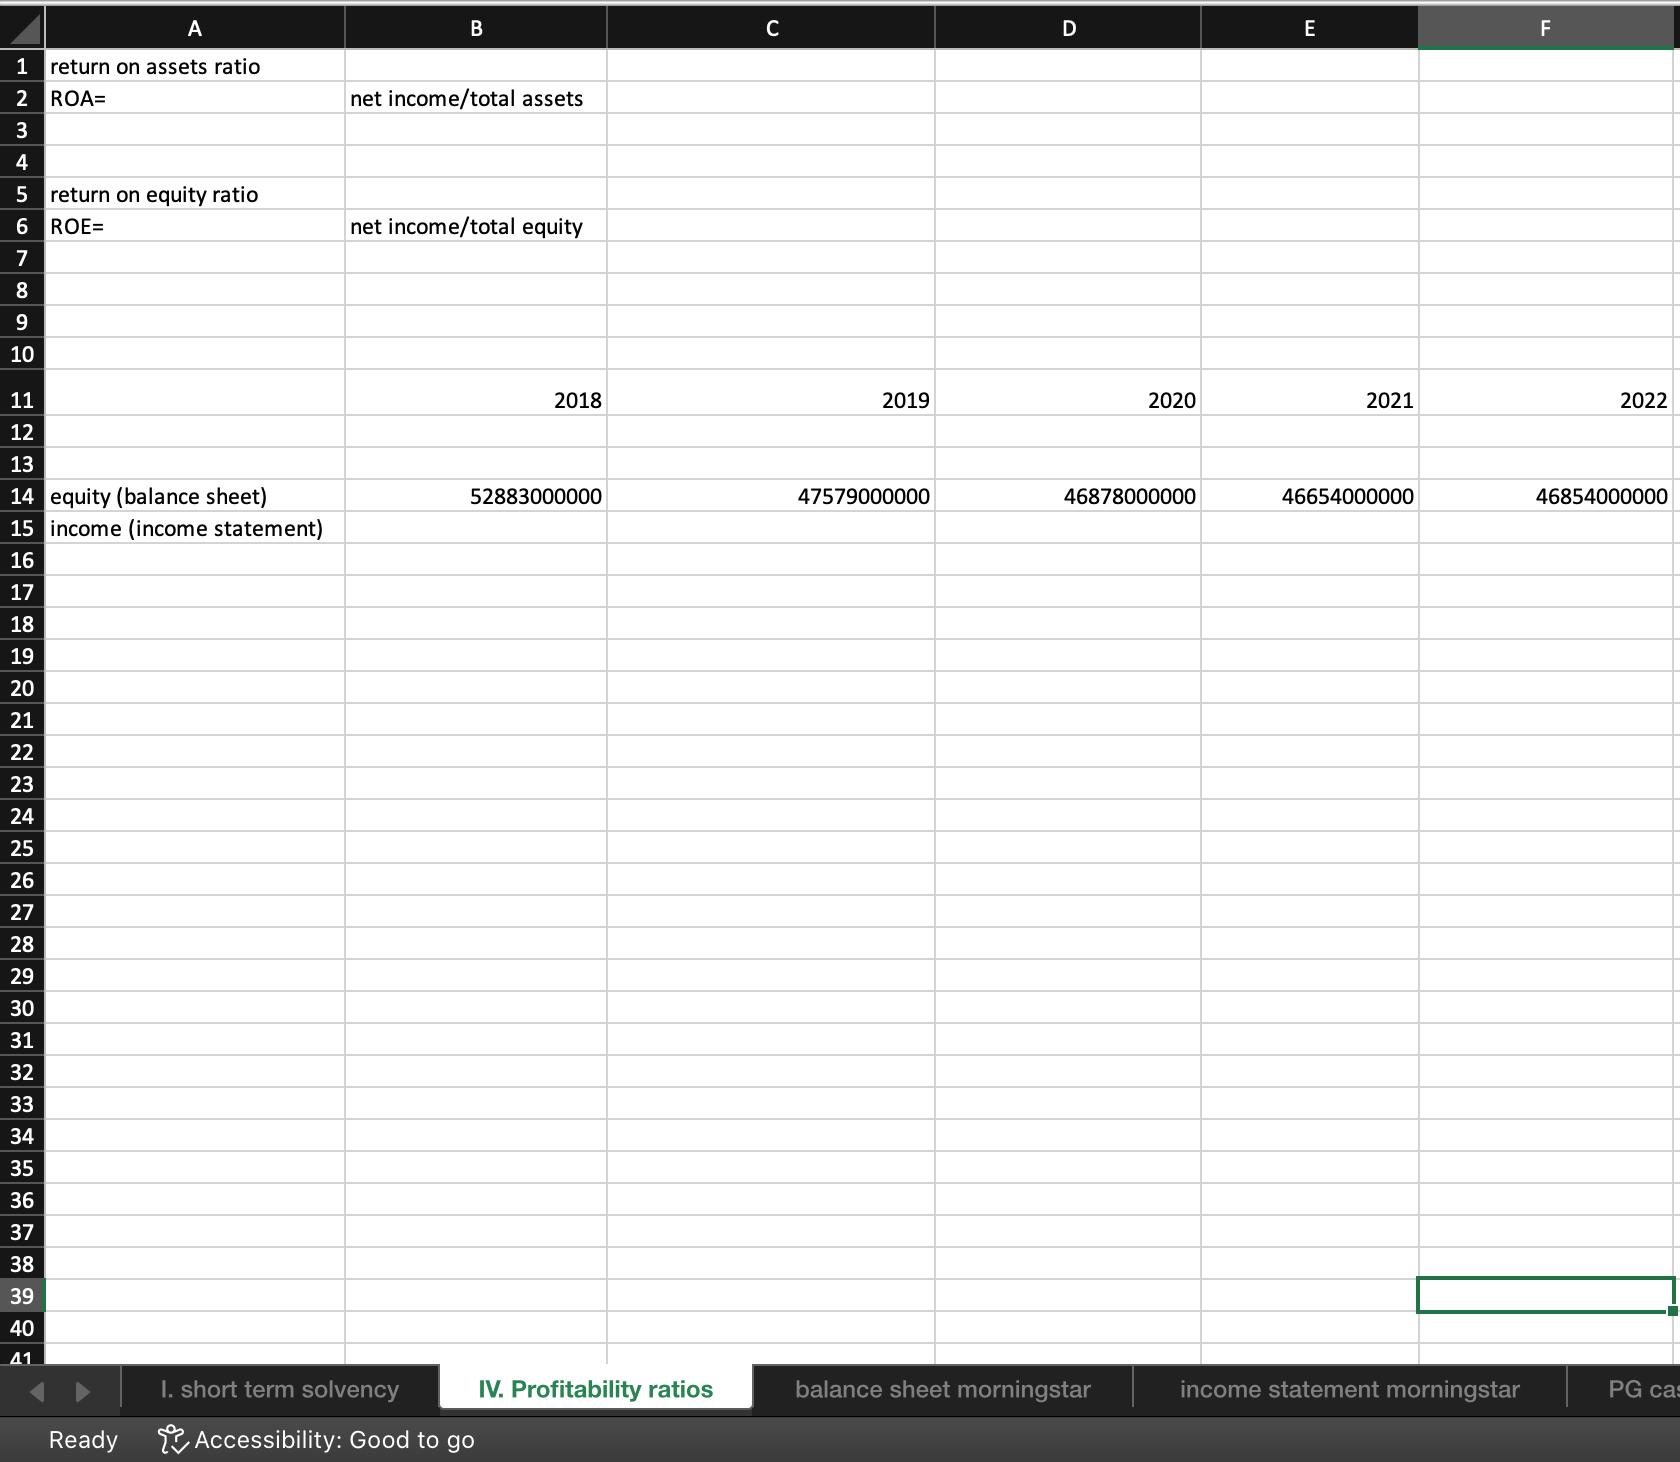
Return on Assets Ratio and the Return on Equity Ratio from the “IV. Profitability ratios” category
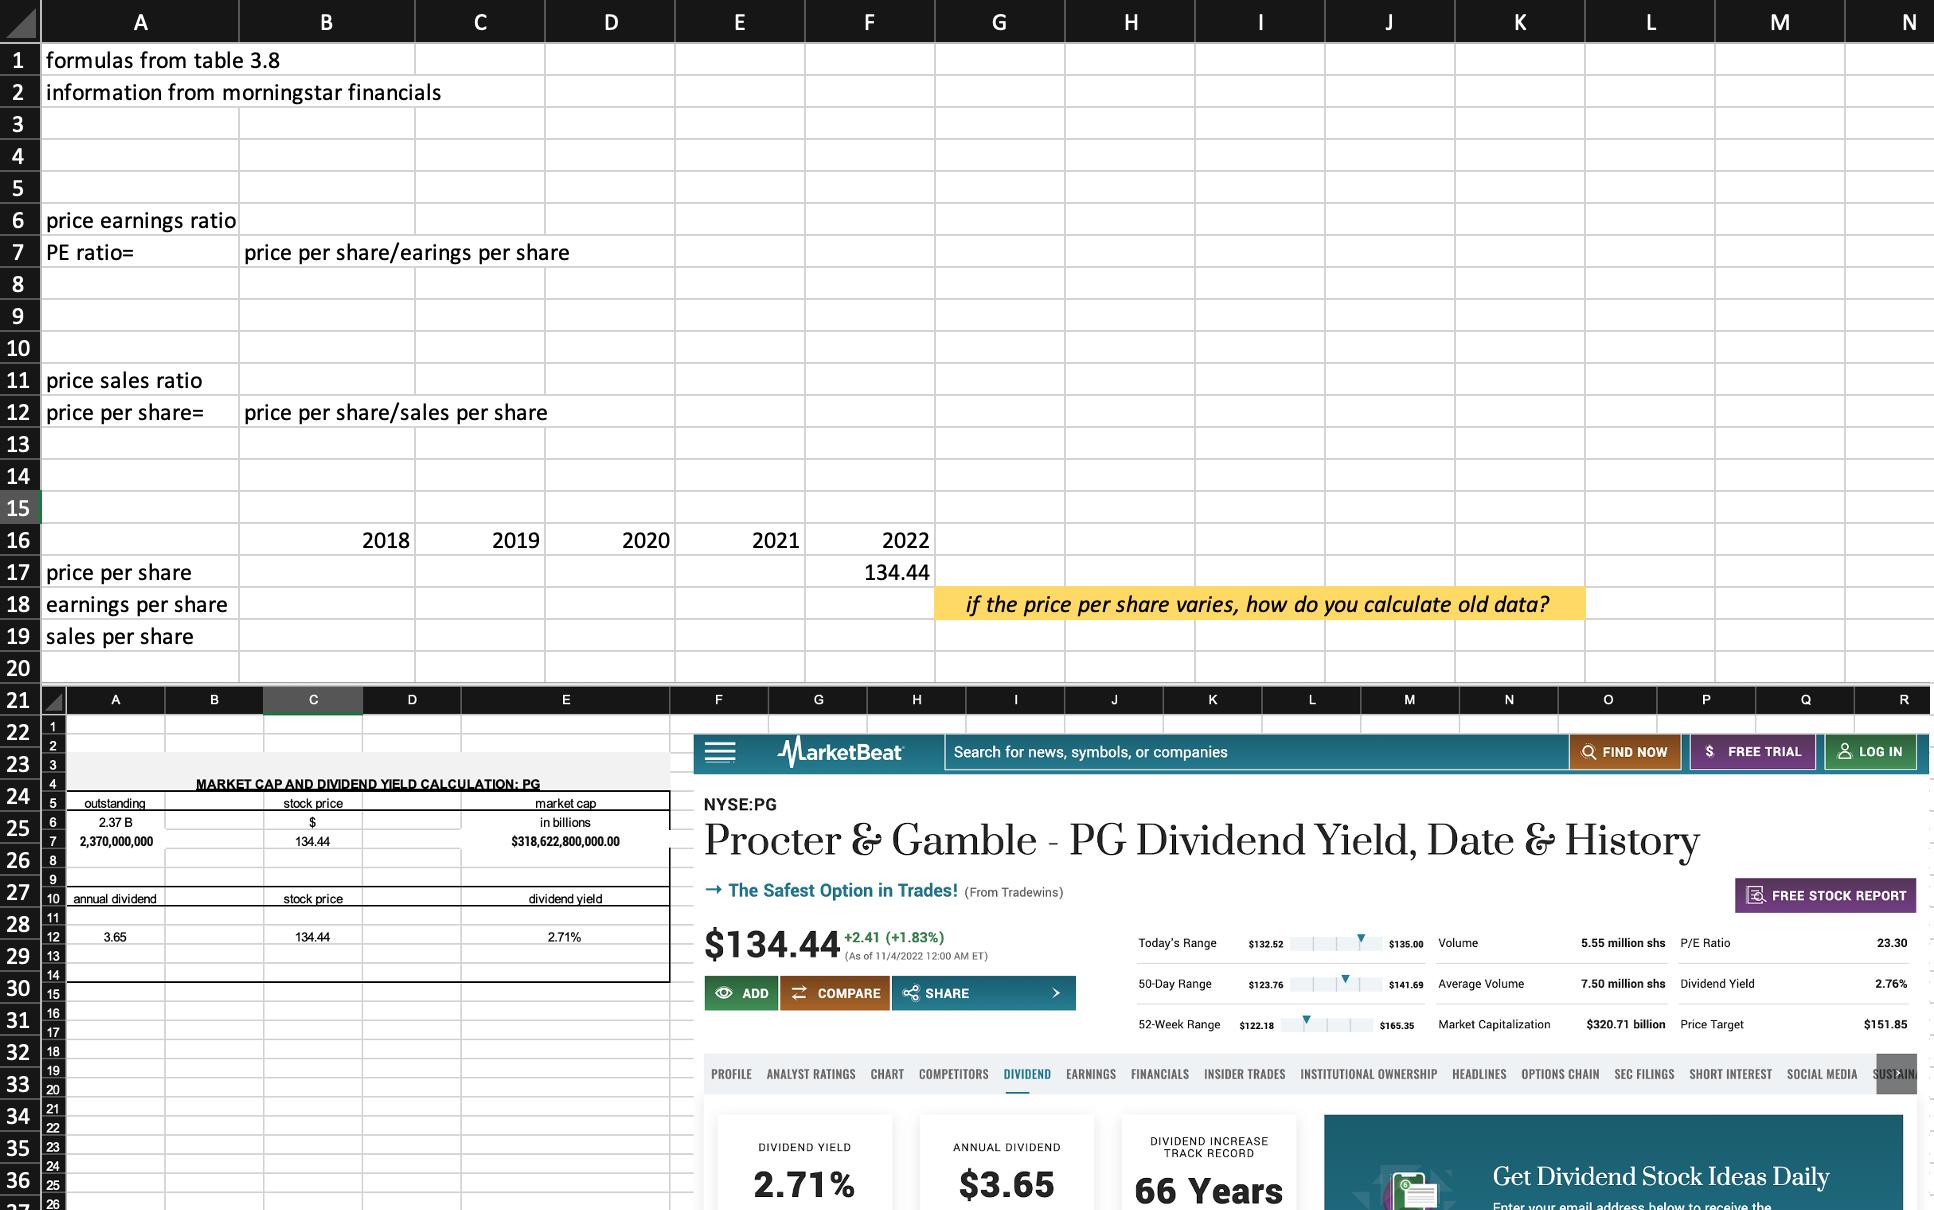
Price Earnings Ratio and the Price Sales Ratio from the “V. Market value ratios” category.
Then provide a one-page (minimum) discussion about what each trend indicates for your assigned corporation. Is the trend good or bad, why?
PG balance sheet from morningstar
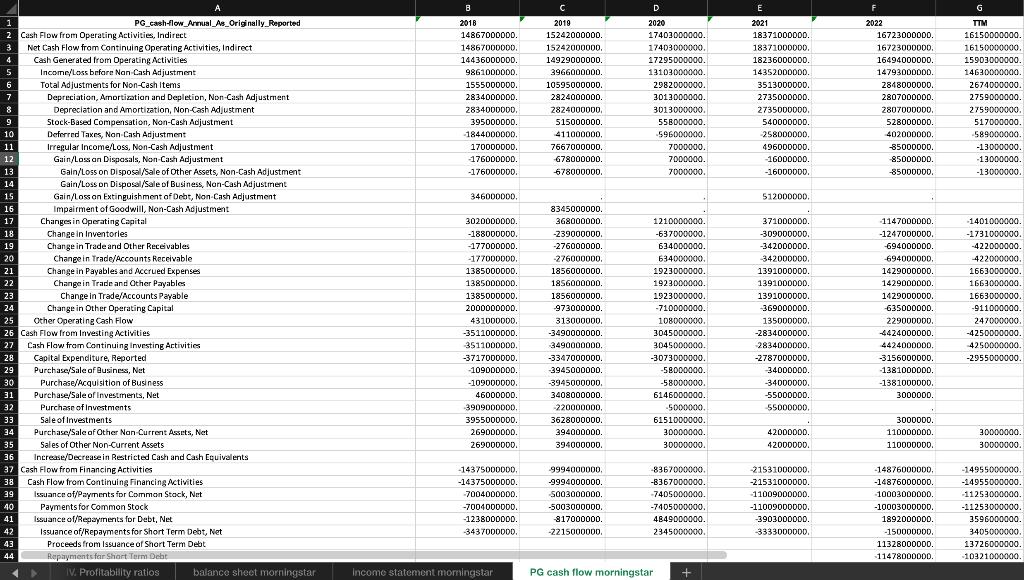
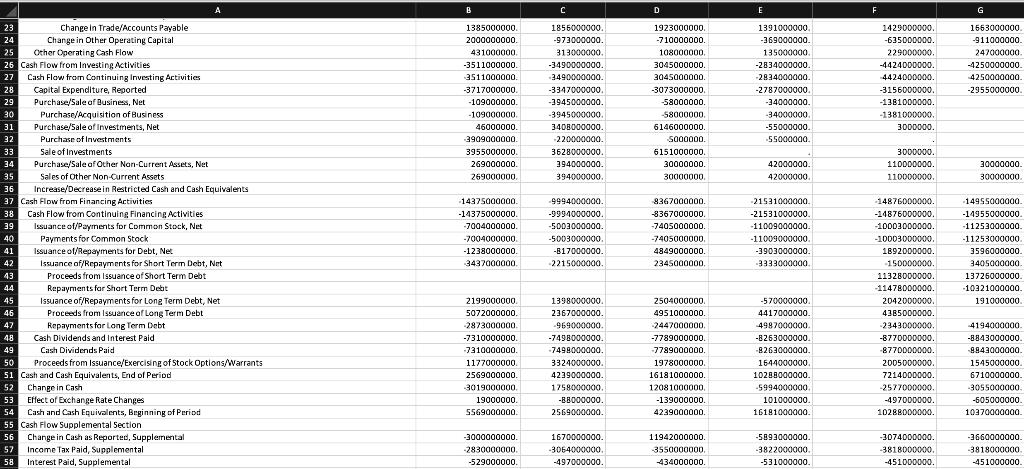
PG cash flow annual from morningstar
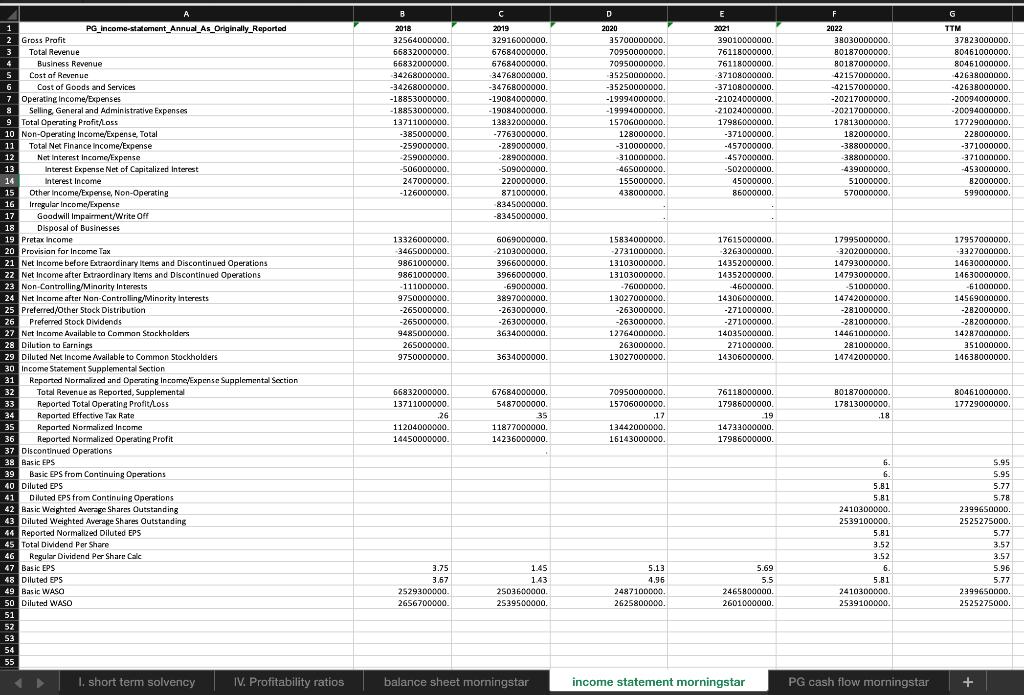
PG income statement from morningstar
Work:
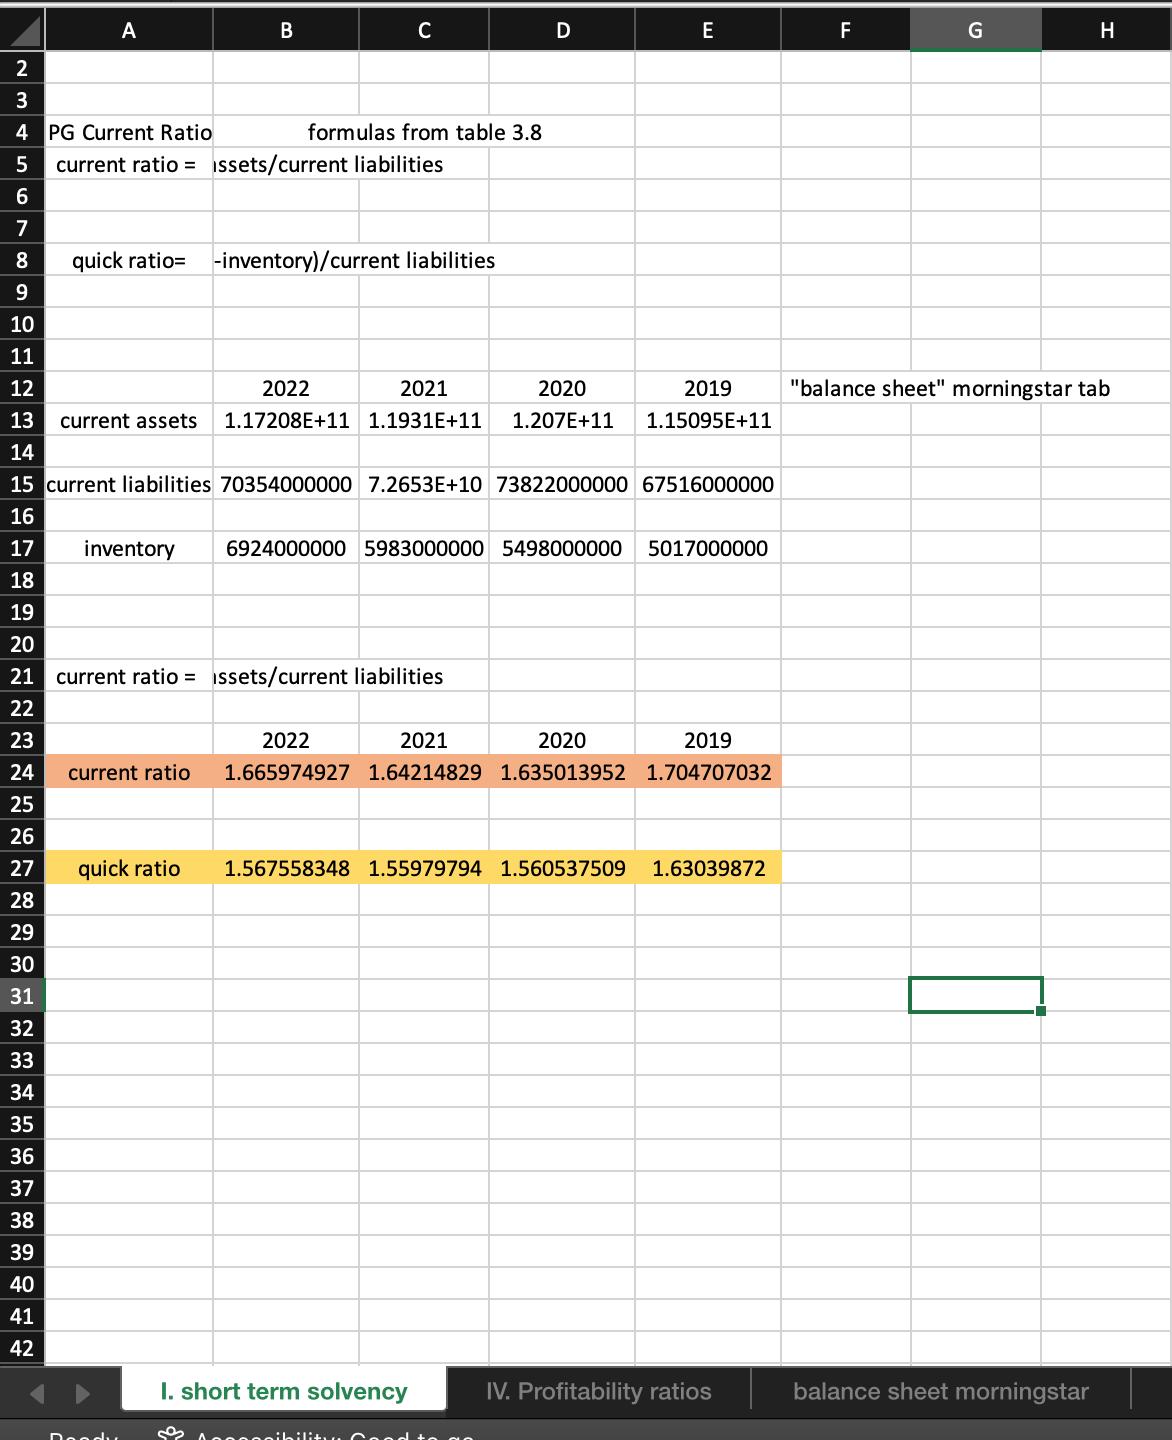
I believe this is right above
this part I'm not sure about
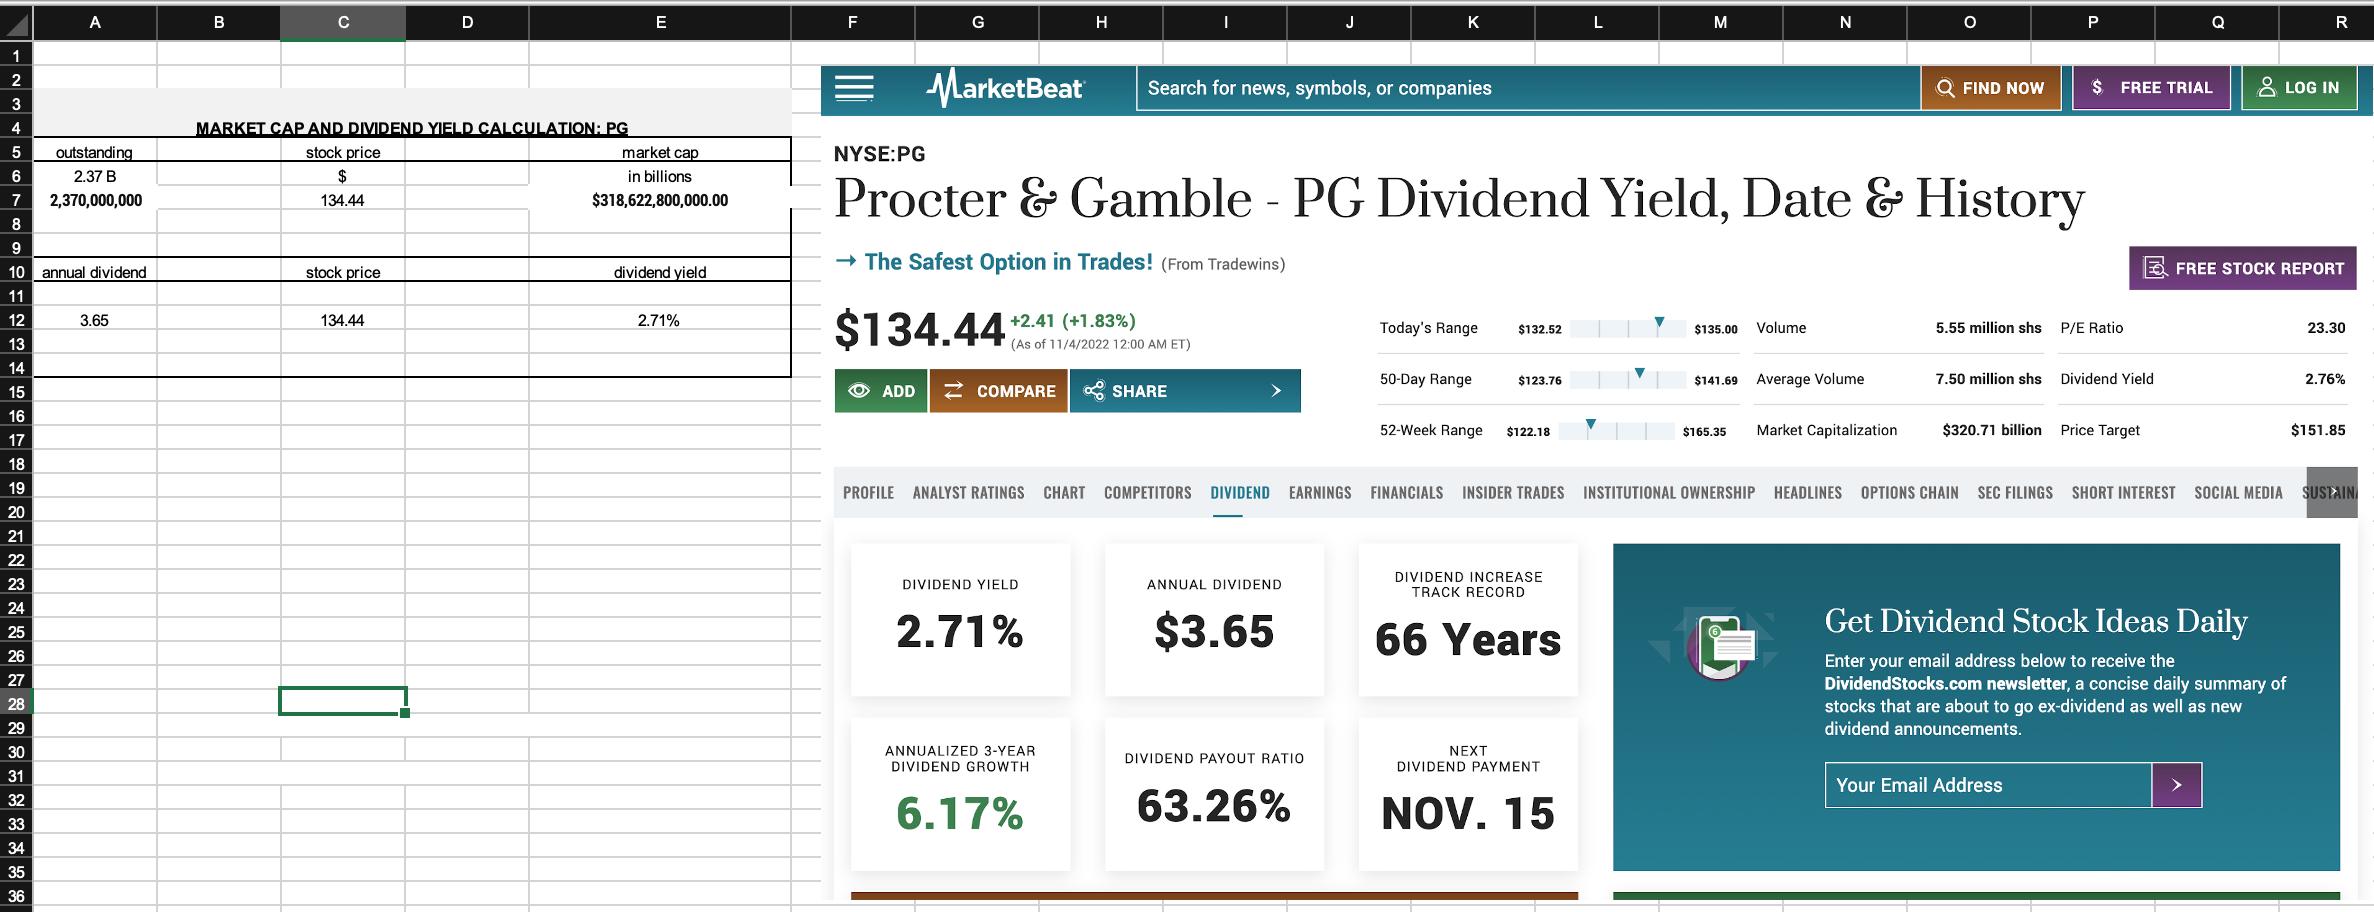
this part I'm not sure. How would you calculate the price per share since the 134.44 isn't accurate for 2021,2020 or any other year?( i included it for the stock price from market beat)
thanks! I can repost additionally if needed. Just wanted to make sure I'm on the right track with short term solvency tab.the two problems below it I'm not sure about.
1 2 3 4 5 6 7 8 9 10 11 12 13 14 15 20 21 22 23 24 25 26 27 28 29 30 31 32 33 34 35 36 37 38 39 40 41 42 PG_balance-sheet_Annual_As_Originally_Reported Total Assets Total Current Assets Cash, Cash Equivalents and Short Term Investments Cash and Cash Equivalents Short Term Investments Available-for-Sale Securities, Current 16 17 Total Non-Current Assets 18 19 Inventories Raw Materials, Consumables and Supplies Work-in-Process Finished Goods and Merchandise Trade and Other Receivables, Current Trade/Accounts Receivable, Current Prepayments and Deposits, Current Deferred Tax Assets, Current Assets Held for Sale/Discontinued Operations, Current Net Property, Plant and Equipment Gross Property, Plant and Equipment Properties Land and Improvements Buildings and Improvements Machinery, Furniture and Equipment Construction in Progress and Advance Payments Accumulated Depreciation and Impairment Accumulated Depreciation. Net Intangible Assets Gross Goodwill and Other Intangible Assets Goodwill Intangibles other than Goodwill Trademarks and Patents Customer Relationships Other Intangible Assets Accumulated Amortization and Impairment. Accumulated Amortization of Intangible Assets. Accumulated Amortization of Intangibles other than Goodwill Accumulated Amortization of Trademarks and Patents Accumulated Amortization of Customer Relationships Accumulated Amortization of Other Intangible Assets Accumulated Impairment of Intangible Assets Accumulated Impairment of Goodwill Other Non-Current Assets Assets Held for Sale/Discontinued Operations, Non-Current 43 44 Total Liabilities B 2018 118310000000. 23320000000, 11850000000. 2569000000. 9281000000. 9281000000. 4738000000. 1335000000. 588000000. 2815000000. 4686000000. 4686000000. 2046000000. 94990000000. 20600000000. 41847000000. 8029000000. 841000000. 7188000000. 30595000000. 3223000000. -21247000000. -21247000000 69077000000. 74233000000. 45175000000. 29058000000. 27445000000. 1372000000. 241000000. -5156000000. -5156000000. -5156000000. -4396000000. -616000000. -144000000. 5313000000. 65427000000. с 2019 115095000000. 22473000000. 10287000000. 4239000000 6048000000. 6048000000. 5017000000. 1289000000. 612000000. 3116000000. 4951000000. 4951000000. 2218000000. 92622000000 21271000000. 43393000000. 8551000000. 805000000. 7746000000. 32263000000. 2579000000. -22122000000 -22122000000. 64488000000 69864000000. 40273000000. 29591000000. 27659000000. 1787000000. 145000000. -5376000000. -5376000000. -5376000000. -4594000000. -691000000. -91000000. 6863000000. 67516000000. D 2020 120700000000. 27987000000. 16181000000. 16181000000. 5498000000. 1414000000. 674000000. 3410000000. 4178000000. 4178000000. 2130000000. 92713000000. 20692000000. 43771000000. 8477000000. 777000000. 7700000000. 33260000000. 2034000000. -23079000000. -23079000000, 63693000000. 69423000000. 39901000000. 29522000000. 27627000000. 1752000000 143000000. -5730000000. -5730000000. -5730000000. -4860000000. -778000000. -92000000. 8328000000. 73822000000. E 2021 119307000000. 23091000000. 10288000000. 10288000000. 5983000000. 1645000000. 719000000. 3619000000 4725000000. 4725000000. 2095000000. 96216000000. 21686000000. 46698000000. 8973000000. 808000000. 8165000000. 35367000000. 2358000000. -25012000000. -25012000000. 64566000000 70666000000. 40924000000. 29742000000. 27803000000. 1789000000. 150000000. -6100000000. -6100000000. -6100000000. -5121000000. -882000000. -97000000. 9964000000. 72653000000. F 2022 117208000000. 21653000000. 7214000000. 7214000000. 6924000000. 2168000000. 856000000. 3900000000. 5143000000 5143000000. 2372000000 95555000000. 21195000000. 46697000000. 8843000000. 756000000. 8087000000. 35098000000. 2756000000. -25502000000. -25502000000. 63379000000. 69652000000. 39700000000. 29952000000. 28008000000. 1797000000. 147000000. -6273000000. -6273000000. -6273000000. -5237000000. -939000000. -97000000. 10981000000. 70354000000. 1 2 3 4 5 6 7 8 9 10 11 12 13 14 15 20 21 22 23 24 25 26 27 28 29 30 31 32 33 34 35 36 37 38 39 40 41 42 PG_balance-sheet_Annual_As_Originally_Reported Total Assets Total Current Assets Cash, Cash Equivalents and Short Term Investments Cash and Cash Equivalents Short Term Investments Available-for-Sale Securities, Current 16 17 Total Non-Current Assets 18 19 Inventories Raw Materials, Consumables and Supplies Work-in-Process Finished Goods and Merchandise Trade and Other Receivables, Current Trade/Accounts Receivable, Current Prepayments and Deposits, Current Deferred Tax Assets, Current Assets Held for Sale/Discontinued Operations, Current Net Property, Plant and Equipment Gross Property, Plant and Equipment Properties Land and Improvements Buildings and Improvements Machinery, Furniture and Equipment Construction in Progress and Advance Payments Accumulated Depreciation and Impairment Accumulated Depreciation. Net Intangible Assets Gross Goodwill and Other Intangible Assets Goodwill Intangibles other than Goodwill Trademarks and Patents Customer Relationships Other Intangible Assets Accumulated Amortization and Impairment. Accumulated Amortization of Intangible Assets. Accumulated Amortization of Intangibles other than Goodwill Accumulated Amortization of Trademarks and Patents Accumulated Amortization of Customer Relationships Accumulated Amortization of Other Intangible Assets Accumulated Impairment of Intangible Assets Accumulated Impairment of Goodwill Other Non-Current Assets Assets Held for Sale/Discontinued Operations, Non-Current 43 44 Total Liabilities B 2018 118310000000. 23320000000, 11850000000. 2569000000. 9281000000. 9281000000. 4738000000. 1335000000. 588000000. 2815000000. 4686000000. 4686000000. 2046000000. 94990000000. 20600000000. 41847000000. 8029000000. 841000000. 7188000000. 30595000000. 3223000000. -21247000000. -21247000000 69077000000. 74233000000. 45175000000. 29058000000. 27445000000. 1372000000. 241000000. -5156000000. -5156000000. -5156000000. -4396000000. -616000000. -144000000. 5313000000. 65427000000. с 2019 115095000000. 22473000000. 10287000000. 4239000000 6048000000. 6048000000. 5017000000. 1289000000. 612000000. 3116000000. 4951000000. 4951000000. 2218000000. 92622000000 21271000000. 43393000000. 8551000000. 805000000. 7746000000. 32263000000. 2579000000. -22122000000 -22122000000. 64488000000 69864000000. 40273000000. 29591000000. 27659000000. 1787000000. 145000000. -5376000000. -5376000000. -5376000000. -4594000000. -691000000. -91000000. 6863000000. 67516000000. D 2020 120700000000. 27987000000. 16181000000. 16181000000. 5498000000. 1414000000. 674000000. 3410000000. 4178000000. 4178000000. 2130000000. 92713000000. 20692000000. 43771000000. 8477000000. 777000000. 7700000000. 33260000000. 2034000000. -23079000000. -23079000000, 63693000000. 69423000000. 39901000000. 29522000000. 27627000000. 1752000000 143000000. -5730000000. -5730000000. -5730000000. -4860000000. -778000000. -92000000. 8328000000. 73822000000. E 2021 119307000000. 23091000000. 10288000000. 10288000000. 5983000000. 1645000000. 719000000. 3619000000 4725000000. 4725000000. 2095000000. 96216000000. 21686000000. 46698000000. 8973000000. 808000000. 8165000000. 35367000000. 2358000000. -25012000000. -25012000000. 64566000000 70666000000. 40924000000. 29742000000. 27803000000. 1789000000. 150000000. -6100000000. -6100000000. -6100000000. -5121000000. -882000000. -97000000. 9964000000. 72653000000. F 2022 117208000000. 21653000000. 7214000000. 7214000000. 6924000000. 2168000000. 856000000. 3900000000. 5143000000 5143000000. 2372000000 95555000000. 21195000000. 46697000000. 8843000000. 756000000. 8087000000. 35098000000. 2756000000. -25502000000. -25502000000. 63379000000. 69652000000. 39700000000. 29952000000. 28008000000. 1797000000. 147000000. -6273000000. -6273000000. -6273000000. -5237000000. -939000000. -97000000. 10981000000. 70354000000.
Expert Answer:
ANSWER TREND function is a builtin function in excel which comes under the category of Statistical f... View the full answer
Students also viewed these finance questions
-
1. What are some norms that might be important to develop in a Cold Stone team? 2. Describe a situation in which conflict might arise in a horizontal team of Crew Members. 3. What might be some of...
-
Some people are tempted to make their finances look worse to get financial aid. Companies sometimes also manage their financial numbers in order to accomplish certain goals. Earnings management is...
-
For this assignment, choose from any two categories products that are at different product life cycle stages. Identify the product life cycle stages for your selected products and provide...
-
The consumer price index tends to underrepresent; overstating underrepresent; understating overrepresent; overstating overrepresent; understating ignore; understating the substitution of lower-priced...
-
Tunningley Services is establishing a new business to serve customers in the Ohio, Kentucky, and Indiana region around the Cincinnati Ohio area. The company has identified 15 key market areas and...
-
On May 1, Year 3, Love Corporation declared a $50,000 cash dividend to be paid on May 31 to shareholders of record on May 15. Required Record the events occurring on May 1 and May 31 in a horizontal...
-
On November 1, 2020, Drucker Co. acquired the following investments in equity securities measured at FV-NI. Kelly Corporation- 500 shares of common stock (no-par) at \(\$ 60\) per share. Keefe...
-
Journal Entries for Fair Value and Equity Methods Presented below are two independent situations. Situation 1 Hatcher Cosmetics acquired 10% of the 200,000 shares of common stock of Ramirez Fashion...
-
excelformula is answer. no hard coding values The Sloan Corporation is trying to choose between the following two mutually exclusive design projects. If the required return is 10 percent, what is the...
-
Refer to the figure for Prob. 5/177. Car A is traveling along the straightaway with speed v, and this speed is decreasing at a rate a. Car C is moving along the circular off-ramp with speed v/2, and...
-
The following stem-and-leaf diagram gives the distances (in thousands of miles) driven during the past year by a sample of drivers in a city. a. Compute the sample mean, median, and mode for the data...
-
1.3 In ANN, what input values will cause the processing unit below to produce an output of 0. (3) -2 5
-
ing is 7 7 years old, and his sight and hearing are defective. One day, while King was driving south on a heavily - traveled street in Owatonna, John ( a fourteen - year - old boy ) crossed the...
-
Sheffield Company estimates that unit sales will be 13,000 in quarter 1, 18,200 in quarter 2, 19,500 in quarter 3, and 23,400 in quarter 4. Using a unit selling price of $68 per unit. Prepare the...
-
Write an HTML document that draws the trapezoid (a rectangle that is wider on one side) below in Canvas. (30,30) 50 50 70
-
3. Refer to your bivariate regression output table, how does income level predict the number of volunteer hours? Is this prediction significant? Explain briefly. H E7 PARTNERSTROONE AutoSave Off File...
-
Question 3 (12 Points) balance sheet was prepared immediately. Partial balance sheet data for the two companies and the acquired controlling ownership of Y consolidated entity at that date follow: X...
-
Wilsons Auto Repair ended 2011 with Accounts Receivable of $85,000 and a credit balance in Allowance for Uncollectible Accounts balance of $11,000. During 2012, Wilsons Auto Repair had the following...
-
1. What are the motivations and personality traits that compel individuals like James Sinegal to strike out on their own, preferring the risks of entrepreneurship to the relative safety of working...
-
Companies such as Wal-Mart and Valero Energy Corp. were days ahead of FEMA in responding to relief operations after Katrina and Rita devastated the Gulf Coast in the fall of 2005. Why do you think...
-
The Vroom-Jago model for group decision making has been criticized as being less than perfect. What do you think are the major criticisms of the model?
-
Papai Ltd bought 51 per cent of the shares in Sons and Co Ltd on 31 October 2007. From the following balance sheets you are to draw up the consolidated balance sheet as at 31 October 2008. Papai...
-
P Ltd bought 40,000 shares in \($1\) Ltd and 27,000 shares in \($2\) Ltd on 31 December 2002. The following balance sheets were drafted as at 31 December 2003. You are to draw up a consolidated...
-
Pops Ltd buys shares in Sub 1 and Sub 2 on 31 December 2007. You are to draft the consolidated balance sheet as at 31 December 2008 from the following: Pops Balance Sheet as at 31 December 2008 E...
Study smarter with the SolutionInn App