

One way to see whether this procedure will be successful is to split the original data...
Fantastic news! We've Found the answer you've been seeking!
Question:
Transcribed Image Text:
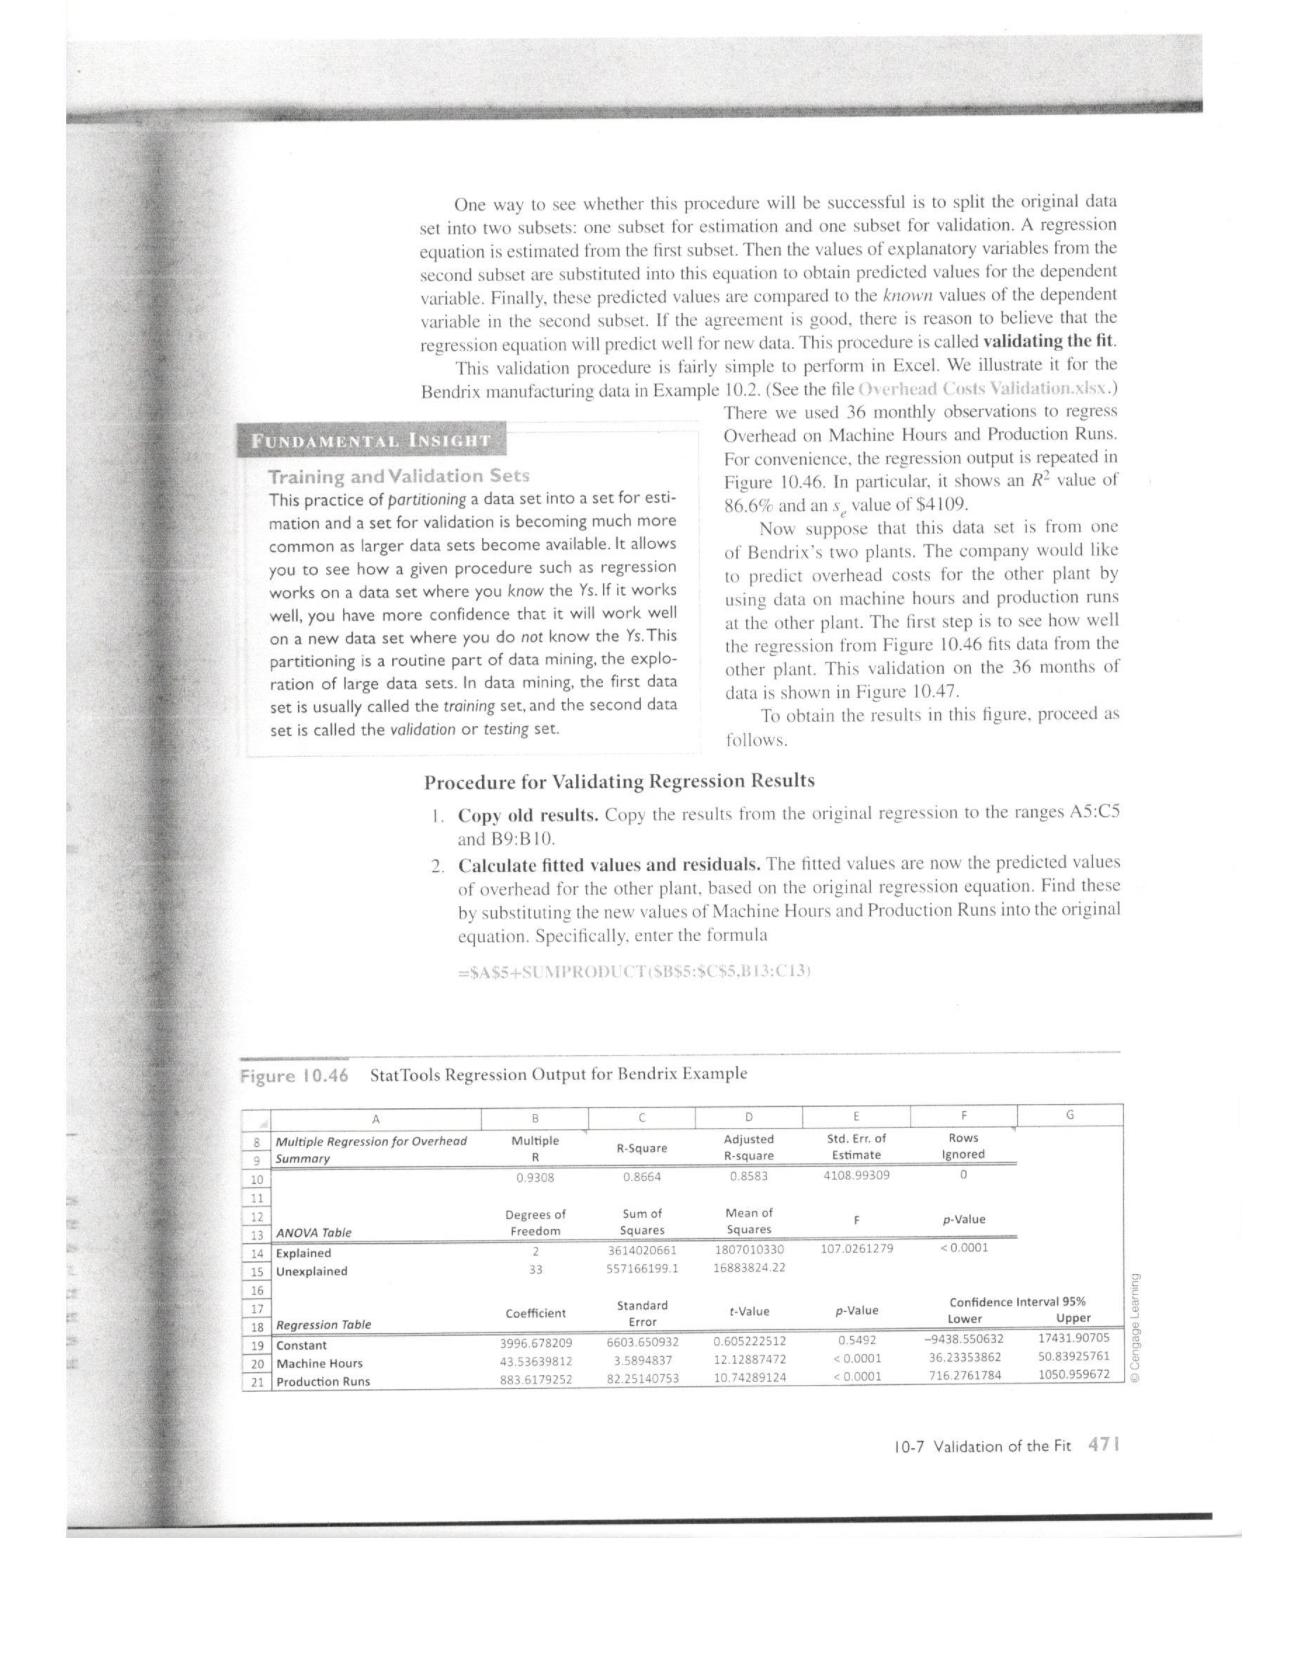
One way to see whether this procedure will be successful is to split the original data set into two subsets: one subset for estimation and one subset for validation. A regression equation is estimated from the first subset. Then the values of explanatory variables from the second subset are substituted into this equation to obtain predicted values for the dependent variable. Finally, these predicted values are compared to the known values of the dependent variable in the second subset. If the agreement is good, there is reason to believe that the regression equation will predict well for new data. This procedure is called validating the fit. This validation procedure is fairly simple to perform in Excel. We illustrate it for the Bendrix manufacturing data in Example 10.2. (See the file Overhead Costs Validation.xlsx.) FUNDAMENTAL INSIGHT Training and Validation Sets This practice of partitioning a data set into a set for esti- mation and a set for validation is becoming much more common as larger data sets become available. It allows you to see how a given procedure such as regression works on a data set where you know the Ys. If it works well, you have more confidence that it will work well on a new data set where you do not know the Ys. This partitioning is a routine part of data mining, the explo- ration of large data sets. In data mining, the first data set is usually called the training set, and the second data set is called the validation or testing set. There we used 36 monthly observations to regress Overhead on Machine Hours and Production Runs. For convenience, the regression output is repeated in Figure 10.46. In particular, it shows an R² value of 86.6% and an s value of $4109. Now suppose that this data set is from one of Bendrix's two plants. The company would like to predict overhead costs for the other plant by using data on machine hours and production runs at the other plant. The first step is to see how well the regression from Figure 10.46 fits data from the other plant. This validation on the 36 months of data is shown in Figure 10.47. To obtain the results in this figure, proceed as follows. Procedure for Validating Regression Results 1. Copy old results. Copy the results from the original regression to the ranges A5:C5 and B9:B10. 2. Calculate fitted values and residuals. The fitted values are now the predicted values of overhead for the other plant, based on the original regression equation. Find these by substituting the new values of Machine Hours and Production Runs into the original equation. Specifically, enter the formula =A55-SUMPRODUCTSB:5:05BE3:013) Figure 10.46 Stat Tools Regression Output for Bendrix Example A B C 8 Multiple Regression for Overhead Summary Multiple R-Square R 10 0.9308 0.8664 D Adjusted R-square 0.8583 F G Std. Err. of Estimate 4108.99309 Rows Ignored 0 11 12 13 ANOVA Table Degrees of Freedom 14 Explained 15 Unexplained 2 33 Sum of Squares 3614020661 557166199.1 Mean of Squares 1807010330 16883824.22 107.0261279 p-Value <0.0001 16 17 Coefficient 18 Regression Table 19 Constant 20 Machine Hours 21 Production Runs 3996.678209 43.53639812 883.6179252 Standard Error 6603.650932 3.5894837 82.25140753 t-Value p-Value 0.605222512 12.12887472 10.74289124 0.5492 <0.0001 <0.0001 Confidence Interval 95% Lower -9438.550632 36.23353862 716.2761784 Upper 17431.90705 50.83925761 1050.959672 10-7 Validation of the Fit 471 Cengage Learning 1. In terms of the estimated data listed on the printout, explained what the R-square does. 2. What does the Constant under the Coefficient (3996.68) tell the analyst? 3. The relationship in the printout measures production costs based on machine hours and production runs. Focusing only on machine hours, provide an interpretation of the machine hours coefficient (43.54). 4. What does the Standard Error of machine hours tell us about this estimate? 5. What do the t-Value and the p-Value tell us about the machine hour coefficient? 6. Can we use the F Statistic to evaluate this model? Why or why not? 7. Should we use this model? Why or why not? 8. Using the machine hours estimate, composed a regression equation of the results on the printout. One way to see whether this procedure will be successful is to split the original data set into two subsets: one subset for estimation and one subset for validation. A regression equation is estimated from the first subset. Then the values of explanatory variables from the second subset are substituted into this equation to obtain predicted values for the dependent variable. Finally, these predicted values are compared to the known values of the dependent variable in the second subset. If the agreement is good, there is reason to believe that the regression equation will predict well for new data. This procedure is called validating the fit. This validation procedure is fairly simple to perform in Excel. We illustrate it for the Bendrix manufacturing data in Example 10.2. (See the file Overhead Costs Validation.xlsx.) FUNDAMENTAL INSIGHT Training and Validation Sets This practice of partitioning a data set into a set for esti- mation and a set for validation is becoming much more common as larger data sets become available. It allows you to see how a given procedure such as regression works on a data set where you know the Ys. If it works well, you have more confidence that it will work well on a new data set where you do not know the Ys. This partitioning is a routine part of data mining, the explo- ration of large data sets. In data mining, the first data set is usually called the training set, and the second data set is called the validation or testing set. There we used 36 monthly observations to regress Overhead on Machine Hours and Production Runs. For convenience, the regression output is repeated in Figure 10.46. In particular, it shows an R² value of 86.6% and an s value of $4109. Now suppose that this data set is from one of Bendrix's two plants. The company would like to predict overhead costs for the other plant by using data on machine hours and production runs at the other plant. The first step is to see how well the regression from Figure 10.46 fits data from the other plant. This validation on the 36 months of data is shown in Figure 10.47. To obtain the results in this figure, proceed as follows. Procedure for Validating Regression Results 1. Copy old results. Copy the results from the original regression to the ranges A5:C5 and B9:B10. 2. Calculate fitted values and residuals. The fitted values are now the predicted values of overhead for the other plant, based on the original regression equation. Find these by substituting the new values of Machine Hours and Production Runs into the original equation. Specifically, enter the formula =A55-SUMPRODUCTSB:5:05BE3:013) Figure 10.46 Stat Tools Regression Output for Bendrix Example A B C 8 Multiple Regression for Overhead Summary Multiple R-Square R 10 0.9308 0.8664 D Adjusted R-square 0.8583 F G Std. Err. of Estimate 4108.99309 Rows Ignored 0 11 12 13 ANOVA Table Degrees of Freedom 14 Explained 15 Unexplained 2 33 Sum of Squares 3614020661 557166199.1 Mean of Squares 1807010330 16883824.22 107.0261279 p-Value <0.0001 16 17 Coefficient 18 Regression Table 19 Constant 20 Machine Hours 21 Production Runs 3996.678209 43.53639812 883.6179252 Standard Error 6603.650932 3.5894837 82.25140753 t-Value p-Value 0.605222512 12.12887472 10.74289124 0.5492 <0.0001 <0.0001 Confidence Interval 95% Lower -9438.550632 36.23353862 716.2761784 Upper 17431.90705 50.83925761 1050.959672 10-7 Validation of the Fit 471 Cengage Learning 1. In terms of the estimated data listed on the printout, explained what the R-square does. 2. What does the Constant under the Coefficient (3996.68) tell the analyst? 3. The relationship in the printout measures production costs based on machine hours and production runs. Focusing only on machine hours, provide an interpretation of the machine hours coefficient (43.54). 4. What does the Standard Error of machine hours tell us about this estimate? 5. What do the t-Value and the p-Value tell us about the machine hour coefficient? 6. Can we use the F Statistic to evaluate this model? Why or why not? 7. Should we use this model? Why or why not? 8. Using the machine hours estimate, composed a regression equation of the results on the printout.
Expert Answer:
Answer rating: 100% (QA)
Lets address each question 1 The Rsquare or coefficient of determination measures the proportion of the variance in the dependent variable Overhead that is explained by the independent variables Machi... View the full answer

Related Book For 
Introduction to Data Mining
ISBN: 978-0321321367
1st edition
Authors: Pang Ning Tan, Michael Steinbach, Vipin Kumar
Posted Date:
Students also viewed these mathematics questions
-
Dentre os indicadores relevantes em demografia e sade pblica, todas as opes abaixo esto corretas, exceto: Selecione uma opo de resposta: a. A maneira mais usada para calcular a fertilidade a Taxa...
-
Read the case study "Southwest Airlines," found in Part 2 of your textbook. Review the "Guide to Case Analysis" found on pp. CA1 - CA11 of your textbook. (This guide follows the last case in the...
-
Python and most Python libraries are free to download or use, though many users use Python through a paid service. Paid services help IT organizations manage the risks associated with the use of...
-
Paula makes the following acquisitions of ordinary shares in Indigent plc: She sells 500 shares on 28 March 2021. No shares are acquired within the next 30 days. (a) Show the s104 holding on 28 March...
-
Let p(x), q(x) denote the following open statements. p(x): x 3 q(x): x + 1 is odd If the universe consists of all integers, what are the truth values of the following statements? (a) q(1) (b) p(3)...
-
Is the United States a net borrower or a net lender? Is it a debtor or a creditor nation?
-
Find on the Internet "Managing the Business Risk of Fraud: A Practical Guide". Who sponsored this guide?
-
Knudsen Corporation was organized on January 1, 2016. During its first year, the corporation issued 2,000 shares of $50 par value preferred stock and 100,000 shares of $10 par value common stock. At...
-
Crane Company sold $7,000,000, 7%, 15-year bonds on January 1, 2022. The bonds were dated January 1, 2022, and pay interest on December 31. The bonds were sold at 97. need help on the last portion ...
-
(26p) Dependency: Using your own words and explanation, answer the following: (3p) Where can we find parallelism in programming? (6p) What is dependency and what are its types (provide one example...
-
Assignment 2 $200,000. Its taxable capital employed in Canada was $350,000 as at December 31, 2019, and $365,000 as at December 31, 2020.
-
2. Write a Matlab code for a homogenous system of linear equations having infinitely many solutions. (balancing of chemical equations) C2H8O2 CO2 + H2O. 3. Write a Matlab code for a non-homogenous...
-
Harris Fabrics computes its plantwide predetermined overhead rate annually on the basis of direct labor-hours. At the beginning of the year, it estimated that 41,000 direct labor-hours would be...
-
The following items were taken from the financial statements of Sandhill Manufacturing, Inc., over a three-year period: Item 2022 2021 2020 Net Sales $224,400 $214,200 $204,000 Cost of Goods Sold...
-
A red blood cell typically carries an excess charge of about -2.5 10-12 C distributed uniformly over its surface. The red blood cells can be modeled as spheres approximately 7.0 m in diameter and...
-
Compute the future value of $1,000, at an interest rate of 3%, Equation 4.11 compounded annually, in 4 years. FV = PV (1+r)"
-
A consumer magazine is evaluating five brands of trash compactors for their effectiveness in reducing the volume of typical household products that are discarded. In the experiment, each block...
-
The probability density of a point x with respect to a multivariate normal distribution having a mean μ and covariance matrix Σ is given by the equation Using the sample...
-
In the initial example of Chapter 2, the statistician says, "Yes, fields 2 and 3 are basically the same." Can you tell from the three lines of sample data that are shown why she says that?
-
How might you address the problem that a histogram depends on the number and location of the bins?
-
Consider the following information for HandyCraft Stores for 2008 and 2009. Required a. Compute ROI for both years. b. Break ROI down into profit margin and investment turnover. c. Comment on the...
-
Return on Investment, Effect of Depreciation The Chief Operating Officer of the Wisconsin Corporation is considering the effect of depreciation on company ROI. In the most recent year, net operating...
-
Waste Management has a subsidiary that disposes of hazardous waste and a subsidiary that collects and disposes of residential garbage. Information related to the two subsidiaries follows: Required a....

Study smarter with the SolutionInn App