

*Output1 [Document1] - IBM SPSS Statistics Viewer File Edit View Data Transform HE Output Regression Title...
Fantastic news! We've Found the answer you've been seeking!
Question:
Transcribed Image Text:
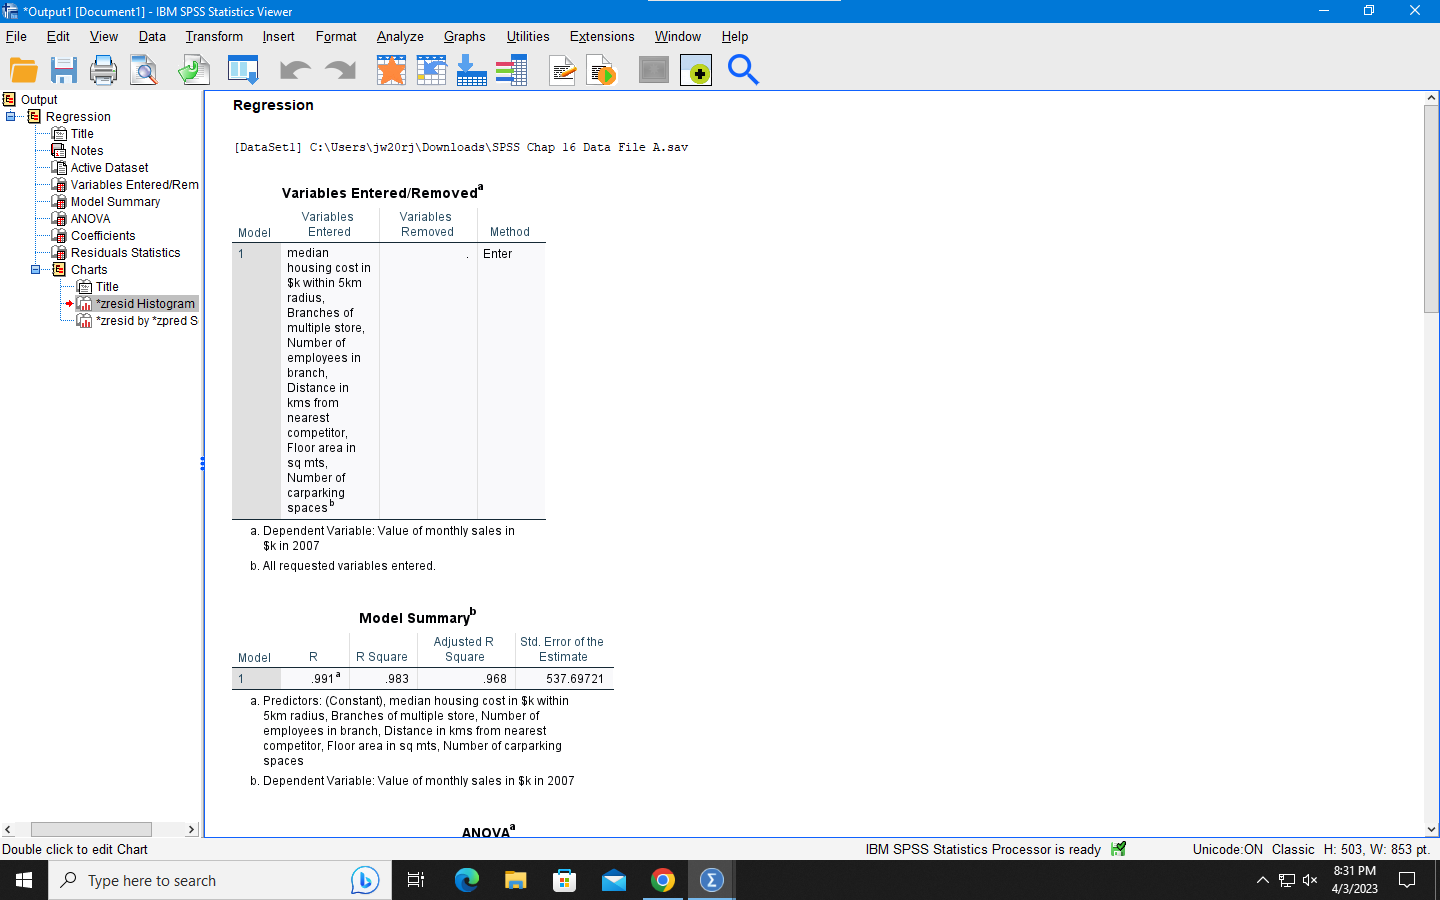
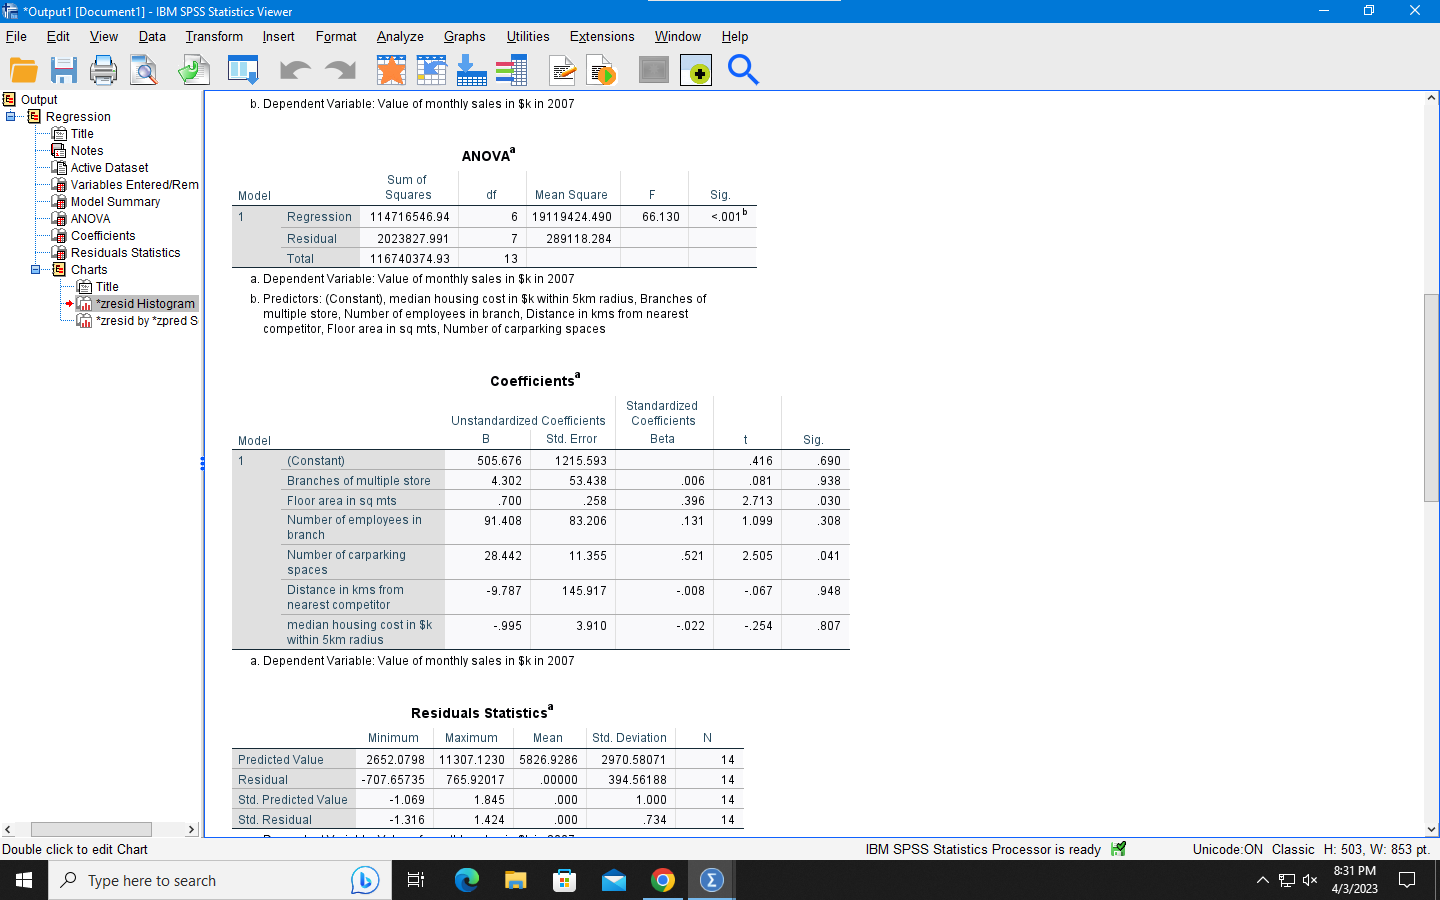
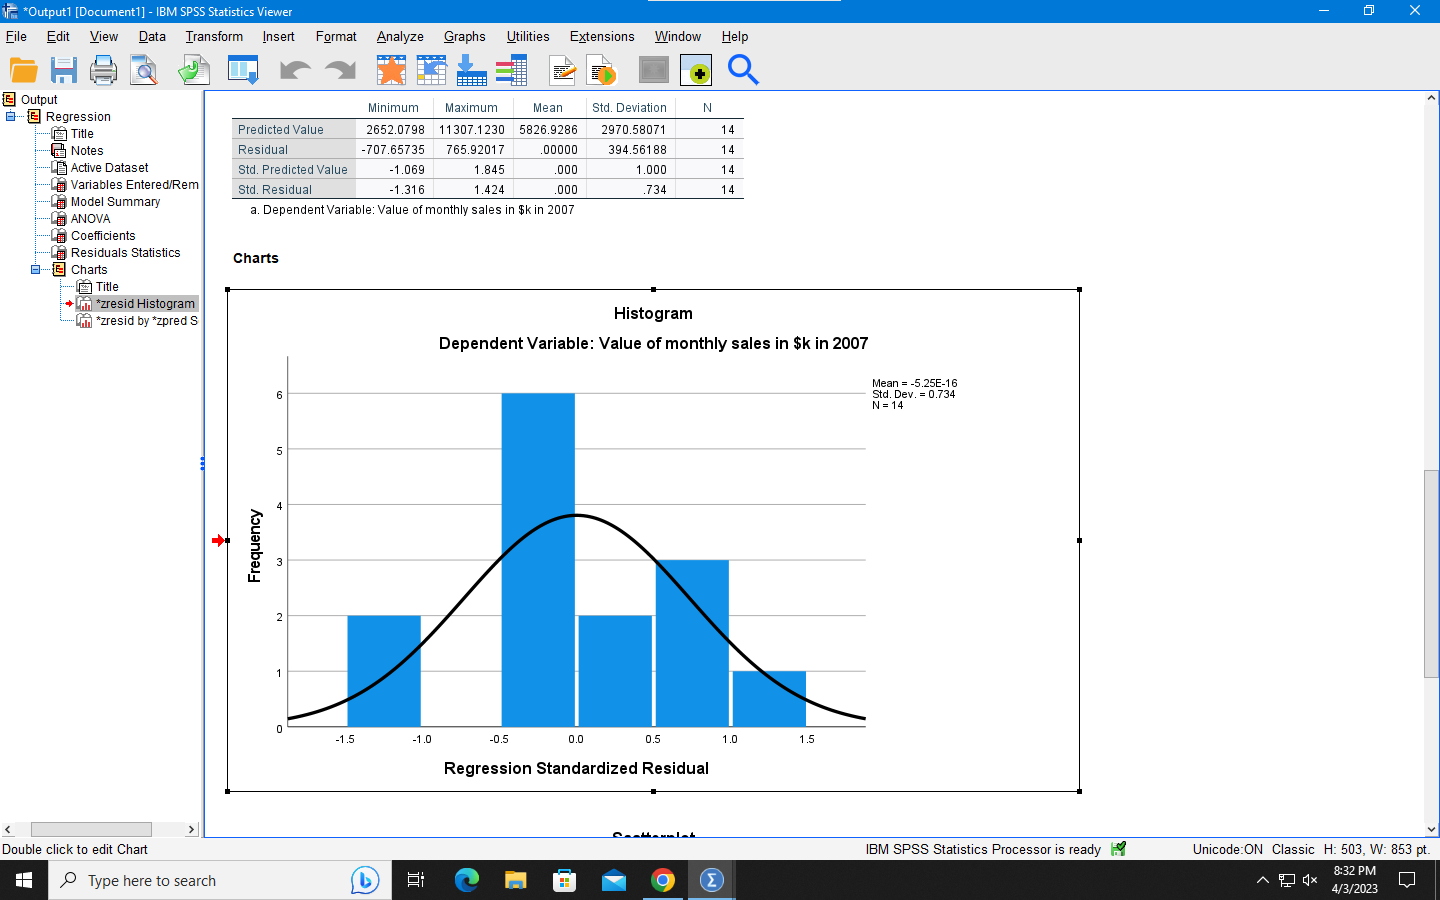
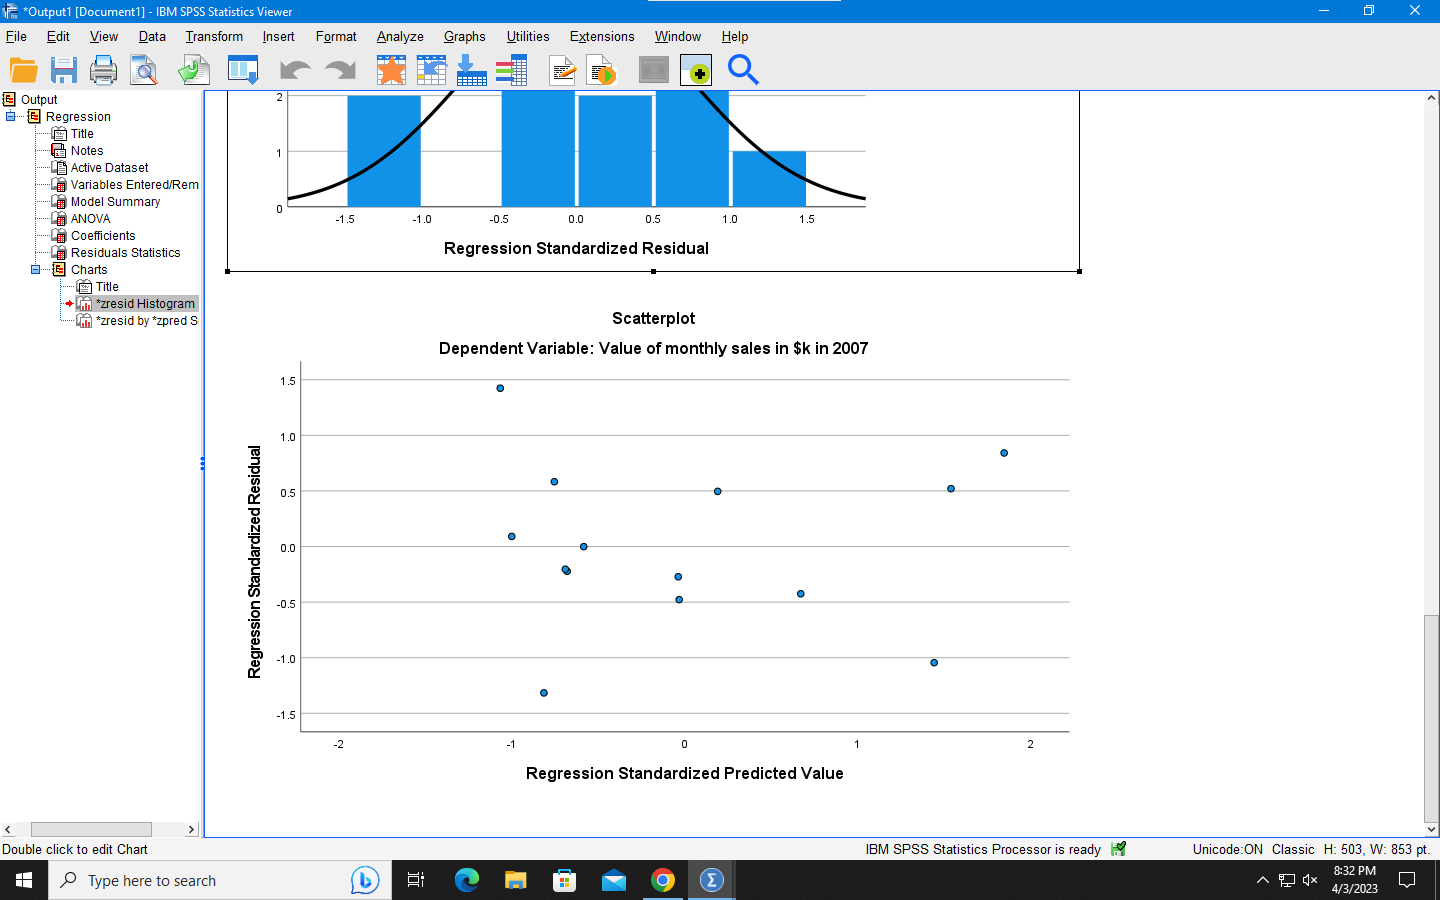
*Output1 [Document1] - IBM SPSS Statistics Viewer File Edit View Data Transform HE Output Regression Title Notes Active Dataset Variables Entered/Rem Model Summary Insert Format Analyze Graphs Utilities Extensions Window Help Regression [DataSet1] C:\Users\jw20rj\Downloads\SPSS Chap 16 Data File A.sav Variables Entered/Removed Q ANOVA Variables Variables Coefficients Model Entered Removed Residuals Statistics 1 median Method Enter Charts housing cost in Title *zresid Histogram *zresid by *zpred S $k within 5km radius, Branches of multiple store, Number of employees in branch, Distance in kms from nearest competitor, Floor area in sq mts, Number of carparking spaces a. Dependent Variable: Value of monthly sales in $k in 2007 b. All requested variables entered. Double click to edit Chart H Model Summary" Model R 1 .991a R Square .983 Adjusted R Square Std. Error of the Estimate .968 537.69721 a. Predictors: (Constant), median housing cost in $k within 5km radius, Branches of multiple store, Number of employees in branch, Distance in kms from nearest competitor, Floor area in sq mts, Number of carparking spaces b. Dependent Variable: Value of monthly sales in $k in 2007 Type here to search () ANOVA IBM SPSS Statistics Processor is ready Unicode:ON Classic H: 503, W: 853 pt. 8:31 PM 4/3/2023 *Output1 [Document1] - IBM SPSS Statistics Viewer File Edit View Data Transform Insert HE Output Format Analyze Graphs Utilities Extensions Window Help Q b. Dependent Variable: Value of monthly sales in $k in 2007 Regression Title Notes Active Dataset Variables Entered/Rem Model Summary ANOVA Coefficients Residuals Statistics Charts Title *zresid Histogram *zresid by *zpred S ANOVA Model 1 Residual Total Sum of Squares df Mean Square F Regression 114716546.94 6 19119424.490 66.130 Sig. *Output1 [Document1] - IBM SPSS Statistics Viewer File Edit View Data Transform HE Output Regression Title Notes Active Dataset Variables Entered/Rem Insert Format Analyze Graphs Utilities Extensions Window Help a Predicted Value Residual Std. Predicted Value Std. Residual Minimum Maximum Mean 2652.0798 11307.1230 5826.9286 -707.65735 765.92017 .00000 -1.069 1.845 .000 -1.316 1.424 Std. Deviation 2970.58071 394.56188 N 14 14 1.000 14 .000 .734 14 a. Dependent Variable: Value of monthly sales in $k in 2007 Model Summary ANOVA Coefficients Residuals Statistics Charts Charts Title *zresid Histogram *zresid by *zpred S Double click to edit Chart H Frequency 6 5 2 1 Histogram Dependent Variable: Value of monthly sales in $k in 2007 Mean = -5.25E-16 Std. Dev. = 0.734 N=14 0 -1.5 -1.0 -0.5 0.0 0.5 Type here to search b Regression Standardized Residual 1.0 1.5 IBM SPSS Statistics Processor is ready Unicode:ON Classic H: 503, W: 853 pt. 8:32 PM 4/3/2023 *Output1 [Document1] - IBM SPSS Statistics Viewer File Edit View Data Transform HE Output Regression Title Notes Active Dataset Insert Format 2 1 Analyze Graphs Utilities Extensions Window Help Variables Entered/Rem Model Summary 0 ANOVA -1.5 -1.0 -0.5 0.0 0.5 Coefficients Residuals Statistics Charts Title *zresid Histogram *zresid by *zpred S Double click to edit Chart H Regression Standardized Residual 1.5 1.0 0.5 0.0 -0.5 -1.0 Regression Standardized Residual 0 1.0 1.5 Scatterplot Dependent Variable: Value of monthly sales in $k in 2007 -1.5 -2 0 1 2 Regression Standardized Predicted Value Type here to search b IBM SPSS Statistics Processor is ready Unicode:ON Classic H: 503, W: 853 pt. 8:32 PM 4/3/2023 *Output1 [Document1] - IBM SPSS Statistics Viewer File Edit View Data Transform HE Output Regression Title Notes Active Dataset Variables Entered/Rem Model Summary Insert Format Analyze Graphs Utilities Extensions Window Help Regression [DataSet1] C:\Users\jw20rj\Downloads\SPSS Chap 16 Data File A.sav Variables Entered/Removed Q ANOVA Variables Variables Coefficients Model Entered Removed Residuals Statistics 1 median Method Enter Charts housing cost in Title *zresid Histogram *zresid by *zpred S $k within 5km radius, Branches of multiple store, Number of employees in branch, Distance in kms from nearest competitor, Floor area in sq mts, Number of carparking spaces a. Dependent Variable: Value of monthly sales in $k in 2007 b. All requested variables entered. Double click to edit Chart H Model Summary" Model R 1 .991a R Square .983 Adjusted R Square Std. Error of the Estimate .968 537.69721 a. Predictors: (Constant), median housing cost in $k within 5km radius, Branches of multiple store, Number of employees in branch, Distance in kms from nearest competitor, Floor area in sq mts, Number of carparking spaces b. Dependent Variable: Value of monthly sales in $k in 2007 Type here to search () ANOVA IBM SPSS Statistics Processor is ready Unicode:ON Classic H: 503, W: 853 pt. 8:31 PM 4/3/2023 *Output1 [Document1] - IBM SPSS Statistics Viewer File Edit View Data Transform Insert HE Output Format Analyze Graphs Utilities Extensions Window Help Q b. Dependent Variable: Value of monthly sales in $k in 2007 Regression Title Notes Active Dataset Variables Entered/Rem Model Summary ANOVA Coefficients Residuals Statistics Charts Title *zresid Histogram *zresid by *zpred S ANOVA Model 1 Residual Total Sum of Squares df Mean Square F Regression 114716546.94 6 19119424.490 66.130 Sig. *Output1 [Document1] - IBM SPSS Statistics Viewer File Edit View Data Transform HE Output Regression Title Notes Active Dataset Variables Entered/Rem Insert Format Analyze Graphs Utilities Extensions Window Help a Predicted Value Residual Std. Predicted Value Std. Residual Minimum Maximum Mean 2652.0798 11307.1230 5826.9286 -707.65735 765.92017 .00000 -1.069 1.845 .000 -1.316 1.424 Std. Deviation 2970.58071 394.56188 N 14 14 1.000 14 .000 .734 14 a. Dependent Variable: Value of monthly sales in $k in 2007 Model Summary ANOVA Coefficients Residuals Statistics Charts Charts Title *zresid Histogram *zresid by *zpred S Double click to edit Chart H Frequency 6 5 2 1 Histogram Dependent Variable: Value of monthly sales in $k in 2007 Mean = -5.25E-16 Std. Dev. = 0.734 N=14 0 -1.5 -1.0 -0.5 0.0 0.5 Type here to search b Regression Standardized Residual 1.0 1.5 IBM SPSS Statistics Processor is ready Unicode:ON Classic H: 503, W: 853 pt. 8:32 PM 4/3/2023 *Output1 [Document1] - IBM SPSS Statistics Viewer File Edit View Data Transform HE Output Regression Title Notes Active Dataset Insert Format 2 1 Analyze Graphs Utilities Extensions Window Help Variables Entered/Rem Model Summary 0 ANOVA -1.5 -1.0 -0.5 0.0 0.5 Coefficients Residuals Statistics Charts Title *zresid Histogram *zresid by *zpred S Double click to edit Chart H Regression Standardized Residual 1.5 1.0 0.5 0.0 -0.5 -1.0 Regression Standardized Residual 0 1.0 1.5 Scatterplot Dependent Variable: Value of monthly sales in $k in 2007 -1.5 -2 0 1 2 Regression Standardized Predicted Value Type here to search b IBM SPSS Statistics Processor is ready Unicode:ON Classic H: 503, W: 853 pt. 8:32 PM 4/3/2023
Expert Answer:

Posted Date:
Students also viewed these mathematics questions
-
If you were the lead analyst for LGM, how would you determine the requirements? Be specific in your answer. List several questions you need answered. Artif. Intell. Med., 56 (3) pp. 137-156, Link:...
-
Return to the facts of problem 39. Assume that Jeremy dies when the passive activity has a fair market value of $25,000. What is the effect on Jeremy's taxable income for the year he dies?
-
This case will help you learn to use a companys inventory notes. The notes are part of the financial statements. They give details that would clutter the financial statements themselves. Refer to...
-
Value chain; writing You are the management accountant for a small company that makes and distributes hot sauce. You have been asked to prepare a presentation that will illustrate the company's value...
-
Assume you are the accountant for Parkland Industries. James Parkland, the owner of the company, is in a hurry to receive the financial statements for the year ended December 31, 2016, and asks you...
-
Question 2. (10 Marks, 500 words) One key driver of the 6th Wave of Manufacturing is Artificial Intelligence. What are the potential changes to your industry that may result from new Al applications?...
-
If B equals two and A equals one, what is the value of N what is the relationship called eight equals to be to the end power?
-
2. (15 points) Consider the wage equation wage = Bo + Bieduc + u, u = educ. e where e is a random variable with E(e) Denote the OLS estimator of B to be 3. = 0 and Var(e) = o. Assume that e is...
-
If the speed of sound in water is 1480 m/s and a pirate ship is trying to locate a treasure lost on the floor of the ocean, how far down would they have to dive to retrieve the treasure? Keep in mind...
-
Hudson Company reports the following contribution margin income statement. HUDSON COMPANY Contribution Margin Income Statement For Year Ended December 31 Sales (11,000 units at $300 each) Variable...
-
(a)Calculate the force (in N) needed to bring a 1050 kg car to rest from a speed of 80.0 km/h in a distance of 130 m (a fairly typical distance for a non-panic stop). N (b)Suppose instead the car...
-
Solve the equation |1 + 6| = 7. The solutions are = where 12. Question Help: Video Submit Question and 12=
-
Doran Realty Company purchased a plot of ground for $1,900,000 and spent $4,100,000 in developing it for building lots. The lots were classified into Highland, Midland, and Lowland grades, to sell at...
-
Why is disclosure of depreciation or amortization methods and rates so important?

Study smarter with the SolutionInn App