

Suppose the economy of Poorland is described by the simple Solow model without technological progress or...
Fantastic news! We've Found the answer you've been seeking!
Question:

Transcribed Image Text:
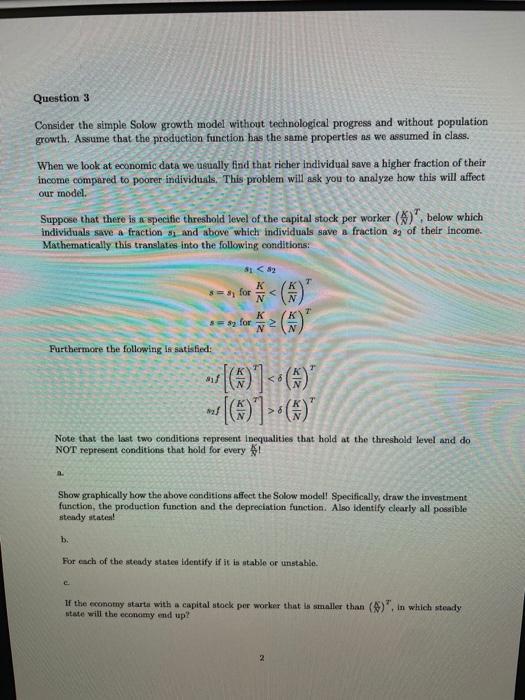
Suppose the economy of Poorland is described by the simple Solow model without technological progress or population growth. The economy starts at the steady state. Suppose another country concludes that income per worker is too low in Poorland and therefore sends them at one-time development aid package (in form of capital) at period to- a. Show what happens as a result of this aid package in a graph showing the production function, investment function and depreciation function (all in per-worker terms). b. Show a time path of output per worker that shows the old steady state, the change due to the aid package and the transition to the long-run equilibrium over time. Briefly explain your graph. C. If Poorland would like to maintain the capital stock per worker that it had right after the aid package was received, what would it need to do? Question 31 Consider the simple Solow growth model without technological progress and without population growth. Assume that the production function has the same properties as we assumed in class. When we look at economic data we usually find that richer individual save a higher fraction of their income compared to poorer individuals. This problem will ask you to analyze how this will affect our model. Suppose that there is a specific threshold level of the capital stock per worker (), below which individuals save a fractions and above which individuals save a fraction ag of their income. Mathematically this translates into the following conditions: Furthermore the following is satisfied: A. 8=sy for 81 < 82 ss for e mf N < 2 T [)]*) [(G)]> * (*)* Note that the last two conditions represent inequalities that hold at the threshold level and do NOT represent conditions that hold for every 1 Show graphically how the above conditions affect the Solow model! Specifically, draw the investment function, the production function and the depreciation function. Also identify clearly all possible steady states! b. For each of the steady states identify if it is stable or unstable. If the economy starts with a capital stock per worker that is smaller than (), in which steady state will the economy end up? Suppose the economy of Poorland is described by the simple Solow model without technological progress or population growth. The economy starts at the steady state. Suppose another country concludes that income per worker is too low in Poorland and therefore sends them at one-time development aid package (in form of capital) at period to- a. Show what happens as a result of this aid package in a graph showing the production function, investment function and depreciation function (all in per-worker terms). b. Show a time path of output per worker that shows the old steady state, the change due to the aid package and the transition to the long-run equilibrium over time. Briefly explain your graph. C. If Poorland would like to maintain the capital stock per worker that it had right after the aid package was received, what would it need to do? Question 31 Consider the simple Solow growth model without technological progress and without population growth. Assume that the production function has the same properties as we assumed in class. When we look at economic data we usually find that richer individual save a higher fraction of their income compared to poorer individuals. This problem will ask you to analyze how this will affect our model. Suppose that there is a specific threshold level of the capital stock per worker (), below which individuals save a fractions and above which individuals save a fraction ag of their income. Mathematically this translates into the following conditions: Furthermore the following is satisfied: A. 8=sy for 81 < 82 ss for e mf N < 2 T [)]*) [(G)]> * (*)* Note that the last two conditions represent inequalities that hold at the threshold level and do NOT represent conditions that hold for every 1 Show graphically how the above conditions affect the Solow model! Specifically, draw the investment function, the production function and the depreciation function. Also identify clearly all possible steady states! b. For each of the steady states identify if it is stable or unstable. If the economy starts with a capital stock per worker that is smaller than (), in which steady state will the economy end up?
Expert Answer:

Related Book For 
Posted Date:
Students also viewed these economics questions
-
Suppose the economy of an underdeveloped country has an agricultural industry and an oil industry, with technology matrix A. (a) If surpluses of 0 units of agricultural products and 610 units of oil...
-
QUESTION 2 Suppose the random variables x and y are independent and both uniformly distributed in the interval [0, 1]. Define the random variable z = |x - Y| (the absolute value of X minus Y). Then,...
-
Suppose the economy of China experiences a currency appreciation-- meaning, it takes more of another country's currency to be exchanged for 1 unit of China's currency. VWhat will be the likely...
-
Hernandez Company began 2010 with a $120,000 balance in retained earnings. During the year, the following events occurred: 1. The company earned net income of $80,000. 2. A material error in net...
-
Dave's Scooters is a small manufacturer of specialty scooters. The company employs 14 production workers and four administrative persons. The following procedures are used to process the company's...
-
Solve problem and graph. -10 8 -3u -6
-
Explain the nature and purpose of the three major financial statements.
-
The following information is available for Laurel Company, a wholesale company: Expected sales volume: October . . . . . . . . . . . . . . . . . . . . . . . . . . . . . . . . . . . . . . . . . . . ....
-
The Knights of St. John set up a ship maintenance machinery at the Grand harbour. What is it called anmd how did it function please?
-
The following table displays the weights for computing the principal components and the data for two observations. Weight PC1 PC2 x1 -0.84 0.43 x2 -0.41 -0.83 x1 x2 Observation 1 5.30 345.70...
-
DETAILS Find the derivative of the function. y = In(x x - 7) 7. [-/1 Points] Need Help? Read It 8. [-/1 Points] DETAILS y' (t) = Need Help? LARCALC12 5.1.047. Find the derivative of the function. y =...
-
To control corona, transmission lines are usually designed to maintain the calculated conductor surface electric field strength below \(\mathrm{kV}_{\mathrm{rms}} / \mathrm{cm}\).
-
When the electric field strength at a conductor surface exceeds the breakdown strength of air, current discharges occur. This phenomenon is called
-
Table 1 shows the demand schedule for Lins Fortune Cookies. Calculate Lins marginal revenue for each quantity demanded. Compare Lins marginal revenue and price. In what type of market does Lins...
-
The affect of the earth plane is to slightly increase the capacitance, and as the line height increases, the effect of earth becomes negligible. (a) True (b) False
-
Considering lines with neutral conductors and earth return, the effect of earth plane is accounted for by the method of conducting earth plane. with a perfectly
-
When the economy is strong, tax cuts may shift AD so far to the right as to generate inflationary pressures, with little gain to GDP. True False
-
Coastal Refining Company operates a refinery with a distillation capacity of 12,000 barrels per day. As a new member of Coastal's management team, you have been given the task of developing a...
-
Plot the following scenarios for per capita GDP on a ratio scale. Assume that per capita GDP in the year 2015 is equal to $10,000. You should not need a calculator or computer program. Use the Rule...
-
Pick two figures from this chapter, and update them to include the latest available data. What does this tell you about how the economy has evolved in response to the financial crisis?
-
An economy begins in steady state with an investment rate of 20 percent, a corporate tax rate of 25 percent, a real interest rate of 2 percent, a depreciation rate of 7 percent, and a price of...
-
Provide an example of two samples that are independent. Explain why these samples are independent.
-
Why is it necessary for all values in the confidence interval to be positive to conclude that 1 > 2? What would have to be true to conclude that 1 < 2?
-
Provide an example of two samples that are paired. Explain why these samples are paired.

Study smarter with the SolutionInn App