

Consider the following actual FY2019 data and a forecast of FY2020 selected balance sheet and income...
Fantastic news! We've Found the answer you've been seeking!
Question:
Transcribed Image Text:
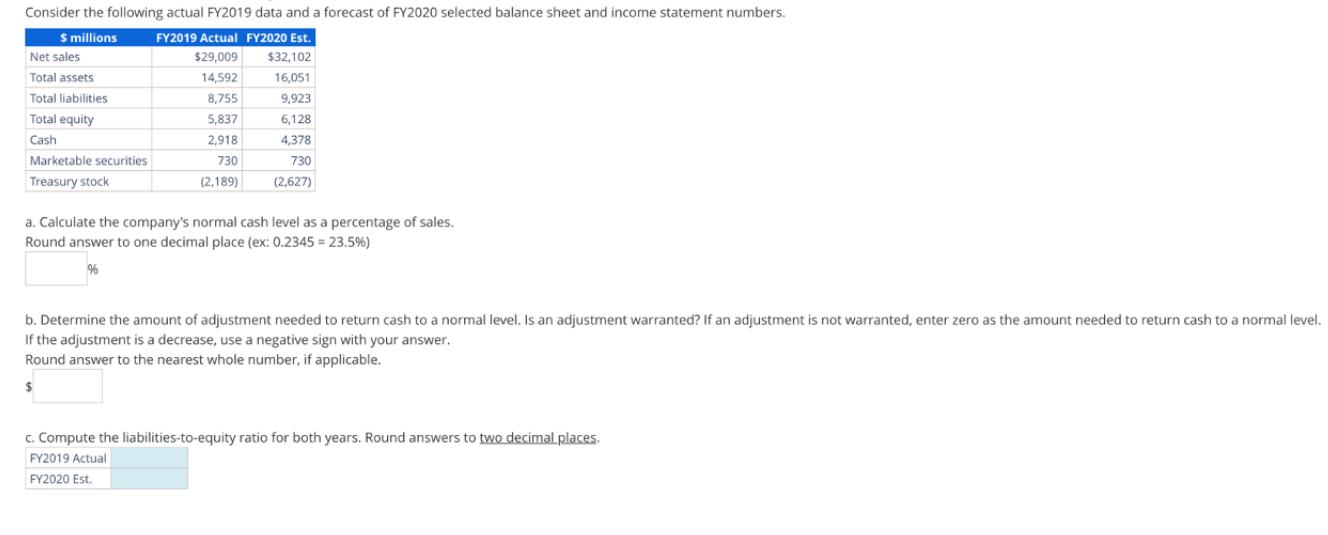
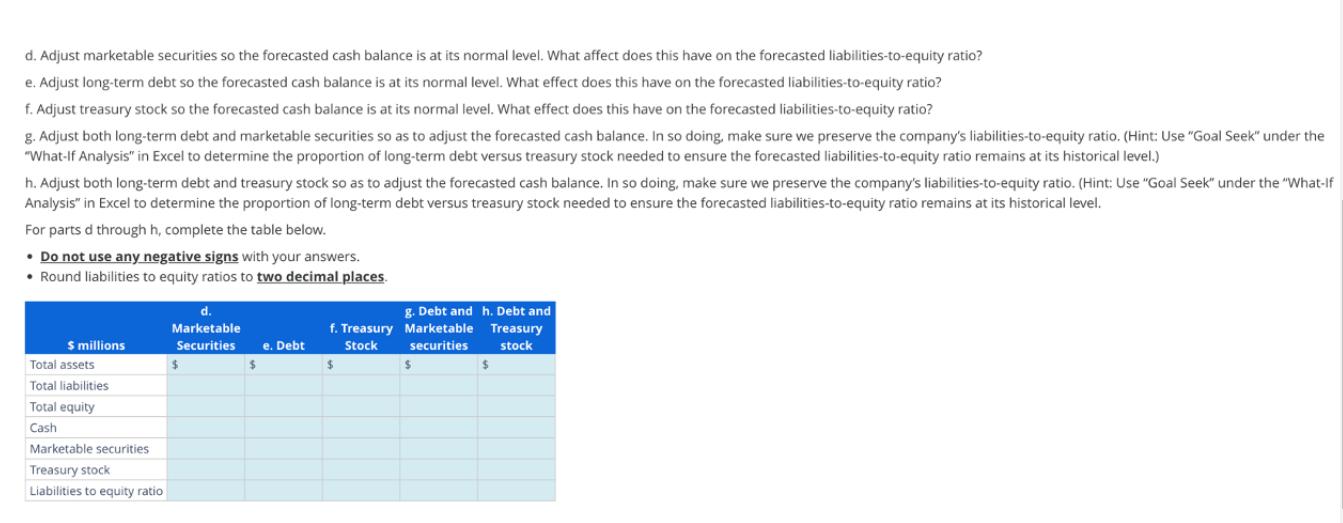
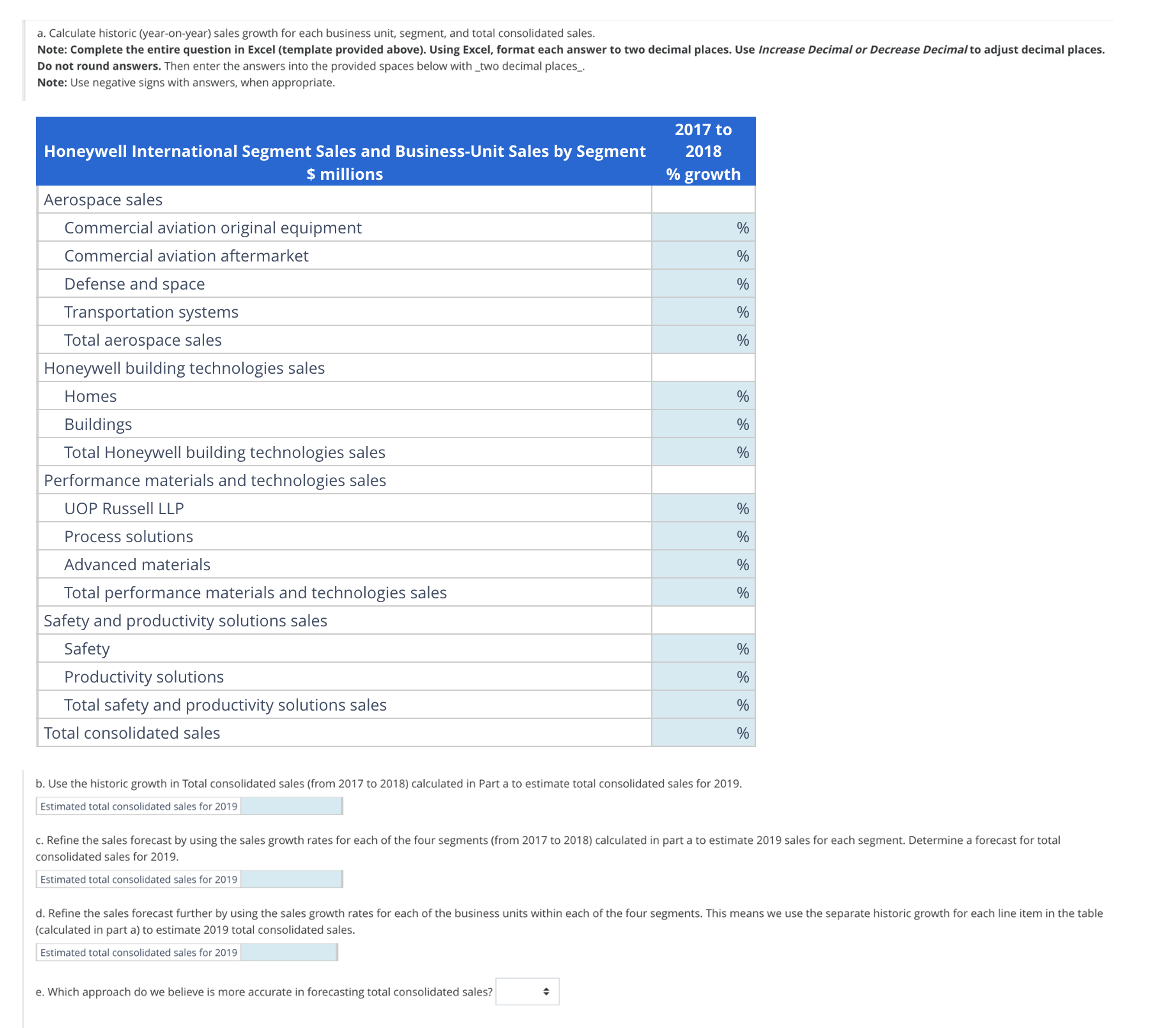
Consider the following actual FY2019 data and a forecast of FY2020 selected balance sheet and income statement numbers. $ millions FY2019 Actual FY2020 Est. $29,009 $32,102 14,592 16,051 8,755 9,923 5,837 6,128 2,918 4,378 730 730 (2,189) (2,627) Net sales Total assets Total liabilities Total equity Cash Marketable securities Treasury stock a. Calculate the company's normal cash level as a percentage of sales. Round answer to one decimal place (ex: 0.2345= 23.5%) % b. Determine the amount of adjustment needed to return cash to a normal level. Is an adjustment warranted? If an adjustment is not warranted, enter zero as the amount needed to return cash to a normal level. If the adjustment is a decrease, use a negative sign with your answer. Round answer to the nearest whole number, if applicable. $ c. Compute the liabilities-to-equity ratio for both years. Round answers to two decimal places. FY2019 Actual FY2020 Est. d. Adjust marketable securities so the forecasted cash balance is at its normal level. What affect does this have on the forecasted liabilities-to-equity ratio? e. Adjust long-term debt so the forecasted cash balance is at its normal level. What effect does this have on the forecasted liabilities-to-equity ratio? f. Adjust treasury stock so the forecasted cash balance is at its normal level. What effect does this have on the forecasted liabilities-to-equity ratio? g. Adjust both long-term debt and marketable securities so as to adjust the forecasted cash balance. In so doing, make sure we preserve the company's liabilities-to-equity ratio. (Hint: Use "Goal Seek" under the "What-If Analysis" in Excel to determine the proportion of long-term debt versus treasury stock needed to ensure the forecasted liabilities-to-equity ratio remains at its historical level.) h. Adjust both long-term debt and treasury stock so as to adjust the forecasted cash balance. In so doing, make sure we preserve the company's liabilities-to-equity ratio. (Hint: Use "Goal Seek" under the "What-if Analysis" in Excel to determine the proportion of long-term debt versus treasury stock needed to ensure the forecasted liabilities-to-equity ratio remains at its historical level. For parts d through h, complete the table below. • Do not use any negative signs with your answers. • Round liabilities to equity ratios to two decimal places. $ millions Total assets Total liabilities Total equity Cash Marketable securities Treasury stock Liabilities to equity ratio d. Marketable Securities e. Debt $ f. Treasury Stock $ g. Debt and h. Debt and Marketable Treasury securities stock $ $ a. Calculate historic (year-on-year) sales growth for each business unit, segment, and total consolidated sales. Note: Complete the entire question in Excel (template provided above). Using Excel, format each answer to two decimal places. Use Increase Decimal or Decrease Decimal to adjust decimal places. Do not round answers. Then enter the answers into the provided spaces below with two decimal places_. Note: Use negative signs with answers, when appropriate. Honeywell International Segment Sales and Business-Unit Sales by Segment $ millions Aerospace sales Commercial aviation original equipment Commercial aviation aftermarket Defense and space Transportation systems Total aerospace sales Honeywell building technologies sales Homes Buildings Total Honeywell building technologies sales Performance materials and technologies sales UOP Russell LLP Process solutions Advanced materials Total performance materials and technologies sales Safety and productivity solutions sales Safety Productivity solutions Total safety and productivity solutions sales. Total consolidated sales 2017 to 2018 % growth % % % % % e. Which approach do we believe is more accurate in forecasting total consolidated sales? % % % + % % % % % % % b. Use the historic growth in Total consolidated sales (from 2017 to 2018) calculated in Part a to estimate total consolidated sales for 2019. Estimated total consolidated sales for 2019 % c. Refine the sales forecast by using the sales growth rates for each of the four segments (from 2017 to 2018) calculated in part a to estimate 2019 sales for each segment. Determine a forecast for total consolidated sales for 2019. Estimated total consolidated sales for 2019 d. Refine the sales forecast further by using the sales growth rates for each of the business units within each of the four segments. This means we use the separate historic growth for each line item in the table (calculated in part a) to estimate 2019 total consolidated sales. Estimated total consolidated sales for 2019 Consider the following actual FY2019 data and a forecast of FY2020 selected balance sheet and income statement numbers. $ millions FY2019 Actual FY2020 Est. $29,009 $32,102 14,592 16,051 8,755 9,923 5,837 6,128 2,918 4,378 730 730 (2,189) (2,627) Net sales Total assets Total liabilities Total equity Cash Marketable securities Treasury stock a. Calculate the company's normal cash level as a percentage of sales. Round answer to one decimal place (ex: 0.2345= 23.5%) % b. Determine the amount of adjustment needed to return cash to a normal level. Is an adjustment warranted? If an adjustment is not warranted, enter zero as the amount needed to return cash to a normal level. If the adjustment is a decrease, use a negative sign with your answer. Round answer to the nearest whole number, if applicable. $ c. Compute the liabilities-to-equity ratio for both years. Round answers to two decimal places. FY2019 Actual FY2020 Est. Consider the following actual FY2019 data and a forecast of FY2020 selected balance sheet and income statement numbers. $ millions FY2019 Actual FY2020 Est. $29,009 $32,102 14,592 16,051 8,755 9,923 5,837 6,128 2,918 4,378 730 730 (2,189) (2,627) Net sales Total assets Total liabilities Total equity Cash Marketable securities Treasury stock a. Calculate the company's normal cash level as a percentage of sales. Round answer to one decimal place (ex: 0.2345= 23.5%) % b. Determine the amount of adjustment needed to return cash to a normal level. Is an adjustment warranted? If an adjustment is not warranted, enter zero as the amount needed to return cash to a normal level. If the adjustment is a decrease, use a negative sign with your answer. Round answer to the nearest whole number, if applicable. $ c. Compute the liabilities-to-equity ratio for both years. Round answers to two decimal places. FY2019 Actual FY2020 Est. d. Adjust marketable securities so the forecasted cash balance is at its normal level. What affect does this have on the forecasted liabilities-to-equity ratio? e. Adjust long-term debt so the forecasted cash balance is at its normal level. What effect does this have on the forecasted liabilities-to-equity ratio? f. Adjust treasury stock so the forecasted cash balance is at its normal level. What effect does this have on the forecasted liabilities-to-equity ratio? g. Adjust both long-term debt and marketable securities so as to adjust the forecasted cash balance. In so doing, make sure we preserve the company's liabilities-to-equity ratio. (Hint: Use "Goal Seek" under the "What-If Analysis" in Excel to determine the proportion of long-term debt versus treasury stock needed to ensure the forecasted liabilities-to-equity ratio remains at its historical level.) h. Adjust both long-term debt and treasury stock so as to adjust the forecasted cash balance. In so doing, make sure we preserve the company's liabilities-to-equity ratio. (Hint: Use "Goal Seek" under the "What-if Analysis" in Excel to determine the proportion of long-term debt versus treasury stock needed to ensure the forecasted liabilities-to-equity ratio remains at its historical level. For parts d through h, complete the table below. • Do not use any negative signs with your answers. • Round liabilities to equity ratios to two decimal places. $ millions Total assets Total liabilities Total equity Cash Marketable securities Treasury stock Liabilities to equity ratio d. Marketable Securities e. Debt $ f. Treasury Stock $ g. Debt and h. Debt and Marketable Treasury securities stock $ $ d. Adjust marketable securities so the forecasted cash balance is at its normal level. What affect does this have on the forecasted liabilities-to-equity ratio? e. Adjust long-term debt so the forecasted cash balance is at its normal level. What effect does this have on the forecasted liabilities-to-equity ratio? f. Adjust treasury stock so the forecasted cash balance is at its normal level. What effect does this have on the forecasted liabilities-to-equity ratio? g. Adjust both long-term debt and marketable securities so as to adjust the forecasted cash balance. In so doing, make sure we preserve the company's liabilities-to-equity ratio. (Hint: Use "Goal Seek" under the "What-If Analysis" in Excel to determine the proportion of long-term debt versus treasury stock needed to ensure the forecasted liabilities-to-equity ratio remains at its historical level.) h. Adjust both long-term debt and treasury stock so as to adjust the forecasted cash balance. In so doing, make sure we preserve the company's liabilities-to-equity ratio. (Hint: Use "Goal Seek" under the "What-if Analysis" in Excel to determine the proportion of long-term debt versus treasury stock needed to ensure the forecasted liabilities-to-equity ratio remains at its historical level. For parts d through h, complete the table below. • Do not use any negative signs with your answers. • Round liabilities to equity ratios to two decimal places. $ millions Total assets Total liabilities Total equity Cash Marketable securities Treasury stock Liabilities to equity ratio d. Marketable Securities e. Debt $ f. Treasury Stock $ g. Debt and h. Debt and Marketable Treasury securities stock $ $ a. Calculate historic (year-on-year) sales growth for each business unit, segment, and total consolidated sales. Note: Complete the entire question in Excel (template provided above). Using Excel, format each answer to two decimal places. Use Increase Decimal or Decrease Decimal to adjust decimal places. Do not round answers. Then enter the answers into the provided spaces below with two decimal places_. Note: Use negative signs with answers, when appropriate. Honeywell International Segment Sales and Business-Unit Sales by Segment $ millions Aerospace sales Commercial aviation original equipment Commercial aviation aftermarket Defense and space Transportation systems Total aerospace sales Honeywell building technologies sales Homes Buildings Total Honeywell building technologies sales Performance materials and technologies sales UOP Russell LLP Process solutions Advanced materials Total performance materials and technologies sales Safety and productivity solutions sales Safety Productivity solutions Total safety and productivity solutions sales. Total consolidated sales 2017 to 2018 % growth % % % % % e. Which approach do we believe is more accurate in forecasting total consolidated sales? % % % + % % % % % % % b. Use the historic growth in Total consolidated sales (from 2017 to 2018) calculated in Part a to estimate total consolidated sales for 2019. Estimated total consolidated sales for 2019 % c. Refine the sales forecast by using the sales growth rates for each of the four segments (from 2017 to 2018) calculated in part a to estimate 2019 sales for each segment. Determine a forecast for total consolidated sales for 2019. Estimated total consolidated sales for 2019 d. Refine the sales forecast further by using the sales growth rates for each of the business units within each of the four segments. This means we use the separate historic growth for each line item in the table (calculated in part a) to estimate 2019 total consolidated sales. Estimated total consolidated sales for 2019 a. Calculate historic (year-on-year) sales growth for each business unit, segment, and total consolidated sales. Note: Complete the entire question in Excel (template provided above). Using Excel, format each answer to two decimal places. Use Increase Decimal or Decrease Decimal to adjust decimal places. Do not round answers. Then enter the answers into the provided spaces below with two decimal places_. Note: Use negative signs with answers, when appropriate. Honeywell International Segment Sales and Business-Unit Sales by Segment $ millions Aerospace sales Commercial aviation original equipment Commercial aviation aftermarket Defense and space Transportation systems Total aerospace sales Honeywell building technologies sales Homes Buildings Total Honeywell building technologies sales Performance materials and technologies sales UOP Russell LLP Process solutions Advanced materials Total performance materials and technologies sales Safety and productivity solutions sales Safety Productivity solutions Total safety and productivity solutions sales. Total consolidated sales 2017 to 2018 % growth % % % % % e. Which approach do we believe is more accurate in forecasting total consolidated sales? % % % + % % % % % % % b. Use the historic growth in Total consolidated sales (from 2017 to 2018) calculated in Part a to estimate total consolidated sales for 2019. Estimated total consolidated sales for 2019 % c. Refine the sales forecast by using the sales growth rates for each of the four segments (from 2017 to 2018) calculated in part a to estimate 2019 sales for each segment. Determine a forecast for total consolidated sales for 2019. Estimated total consolidated sales for 2019 d. Refine the sales forecast further by using the sales growth rates for each of the business units within each of the four segments. This means we use the separate historic growth for each line item in the table (calculated in part a) to estimate 2019 total consolidated sales. Estimated total consolidated sales for 2019
Expert Answer:
Answer rating: 100% (QA)
SOLUTION Here are the answers based on the provided data a Historic Sales Growth Rates 20172018 Aerospace sales Commercial aviation original equipment ... View the full answer

Related Book For 

Horngrens Financial and Managerial Accounting
ISBN: 978-0133866292
5th edition
Authors: Tracie L. Nobles, Brenda L. Mattison, Ella Mae Matsumura
Posted Date:
Students also viewed these accounting questions
-
Countywide Cable Services, Inc., is organized with three segments: Metro, Suburban, and Outlying. Data for these segments for the year just ended follow. Metro Suburban Outlying Service revenue $ 1 ,...
-
The following additional information is available for the Dr. Ivan and Irene Incisor family from Chapters 1-5. Ivan's grandfather died and left a portfolio of municipal bonds. In 2012, they pay Ivan...
-
Annapolis Company purchased a $2,000, 7%, 9-year bond at 99 and held it to maturity. The straight line method of amortization is used for both premiums & discounts. What is the net cash received...
-
How do you ensure data quality?
-
Explain the difference between an operating lease and a capital lease.
-
a b 2 100 d 60- 60 g 90 40 40- 20 20 20 C -20 -40- a. Fill out the table using only the following: + 60 -60 -80 -100- 120 -12 9 , 0 f a b C d e f g f(x) f'(x) "(x) b. What points (a, b, c, etc.) on...
-
Look up three not-for-profit organization's Web sites and find a recent annual report or IRS filing. Many charities are also listed at http://www.charitynavigator.org. a. How much did each of the...
-
High-Calibre Products Corporation makes two products: titanium rims and posts. Data regarding the two products follow: Additional information about the company follows: a. Rims require $17 in direct...
-
To improve your website's SEO performance, when should you consider updating your SEO plan? When you write a new blog post When you have a sale or promotion When you add a new service or product When...
-
The beginning inventory at Midnight Supplies and data on purchases and sales for a three month period ending March 31 are as follows: Date Transaction Number of Units Per Unit Total Jan. 1 Inventory...
-
describe the four different measures of capacity in an essay format explain which measure of capacity would be best for setting prices for a company which measure of capacity in your opinion would be...
-
Question 1: Given a binary tree and an integer targetSum, return true if the tree has a root-to-leaf path such that adding up all the values along the path equals targetSum. Note: A leaf is a node...
-
Two gray surfaces with emmissivities &=0.95 and 2=0.6 are located as shown in the figure. The temperature of the plate 1 T=527 K and temperature of the plate 2 is T2=827 K. Calculate the radiation...
-
After receiving her bonus at work for 100,000 pesos, Carolina has decided to invest in stocks. You tell her that she will face different situations that could cause her to lose her assets, but you...
-
Factor out the greatest common factor in the given polynomial. -3 -1 5(z+14) 3+ (z+14) 1 holow
-
In its 2013 Form 10-K report filed with SEC, the Goldman Sachs Group make the following statements about its business activities: Investment banking serves corporate and government clients around the...
-
Problem 1: Use MATLAB to plot the function Z(t) = et
-
Define deferred revenue. Why is it a liability?
-
Parent Furniture Company manufactures and sells oak tables and chairs. Price and cost data for the furniture follow: Parent Furniture has three sales representatives: Archie, Brett, and Cory. Archie...
-
Explain the three basic components of an accounting information system.
-
Utopia Pool Cleaning Service provides pool cleaning services to residential customers. The company has three employees, each assigned to specific customers. The company considers each employees...
-
Number the following activities from 1 to 5 in the order corresponding to the typical flow of cost in a manufacturing company: Record the transfer of raw materials into production. Record cost of...
-
Complete the following T-accounts: Materials Inventory 320 ? 18,120 250 Wages Payable 9,000 300 Work-in-Process Inventory Finished Goods Inventory 1,000 ? ? 1,500 ? ? 9,000 ? 500 1,200
-
Piper Consulting Company incurred the following during 2019: Calculate prime cost and conversion cost for Piper Consulting Company during 2019. Direct labor.. Overhead Selling expenses Administrative...

Study smarter with the SolutionInn App