

In this lab we will be investigating the relationship between the height of a roller coaster...
Fantastic news! We've Found the answer you've been seeking!
Question:
Transcribed Image Text:
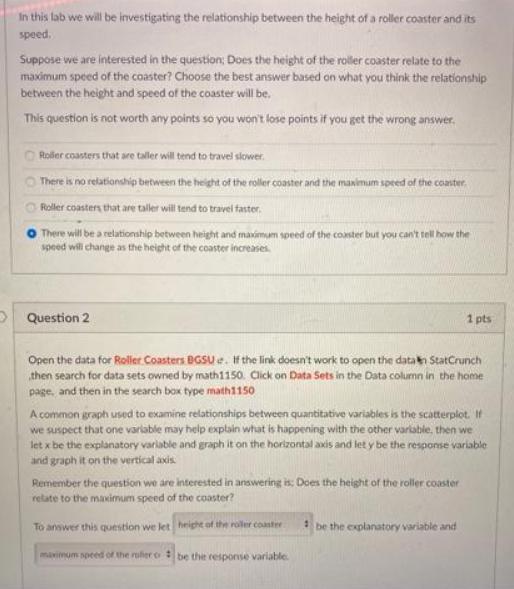
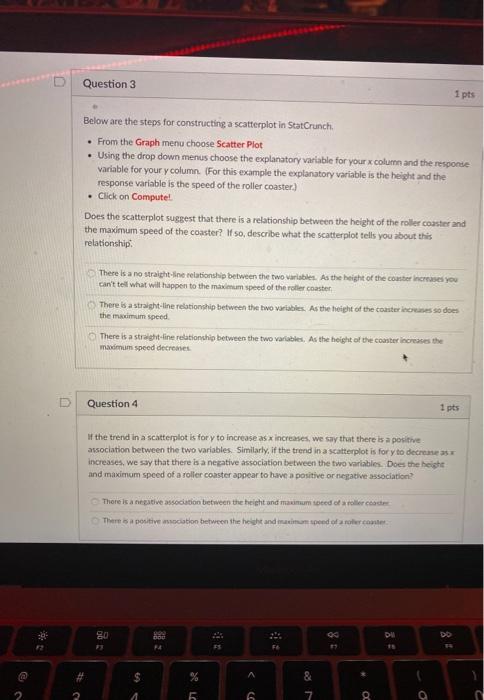
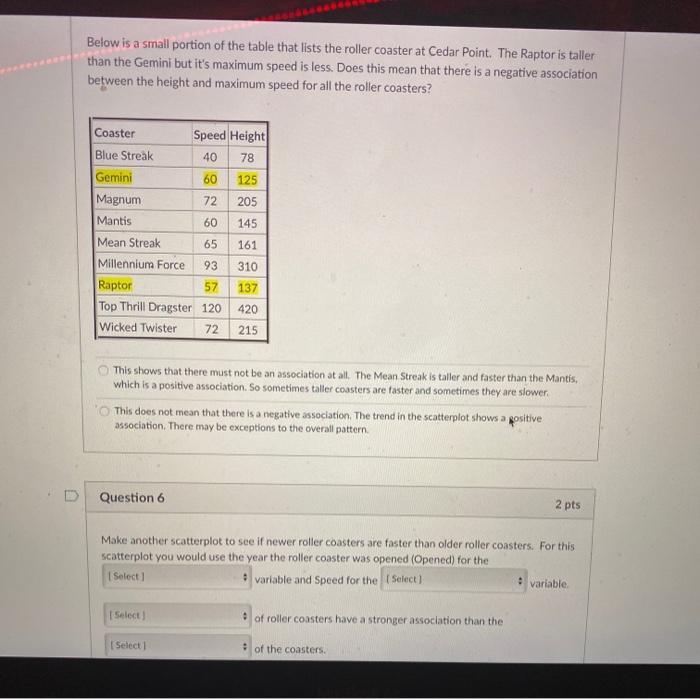
In this lab we will be investigating the relationship between the height of a roller coaster and its speed. Suppose we are interested in the question; Does the height of the roller coaster relate to the maximum speed of the coaster? Choose the best answer based on what you think the relationship between the height and speed of the coaster will be. This question is not worth any points so you won't lose points if you get the wrong answer. Roller coasters that are taller wi will tend to travel slower. There is no relationship between the height of the roller coaster and the maximum speed of the coaster Roller coasters that are taller will tend to travel faster. There will be a relationship between height and maximum speed of the coaster but you can't tell how the speed will change as the height of the coaster increases. Question 2 Open the data for Roller Coasters BGSU e. If the link doesn't work to open the data StatCrunch then search for data sets owned by math1150. Click on Data Sets in the Data column in the home page, and then in the search box type math1150 1 pts A common graph used to examine relationships between quantitative variables is the scatterplot. If we suspect that one variable may help explain what is happening with the other variable, then we let x be the explanatory variable and graph it on the horizontal axis and let y be the response variable and graph it on the vertical axis. Remember the question we are interested in answering is: Does the height of the roller coaster relate to the maximum speed of the coaster? To answer this question we let height of the roller coaster maximum speed of the ruller o be the response variable. 1 be the explanatory variable and @ 2 # 2 Question 3 Below are the steps for constructing a scatterplot in StatCrunch. From the Graph menu choose Scatter Plot . Using the drop down menus choose the explanatory variable for your x column and the response variable for your y column. (For this example the explanatory variable is the height and the response variable is the speed of the roller coaster) . Click on Compute! Does the scatterplot suggest that there is a relationship between the height of the roller coaster and the maximum speed of the coaster? If so, describe what the scatterplot tells you about this relationship. There is a no straight-line relationship between the two variables. As the height of the coaster increases you can't tell what will happen to the maximum speed of the roller coaster If There is a straight-line relationship between the two variables. As the height of the coaster increases so does the maximum speed. There is a straight-line relationship between the two variables. As the height of the coaster increases the maximum speed decreases Question 4 in a scatterplot is for y to increase as x increases, we say that there is a positive association between the two variables. Similarly, if the trend in a scatterplot is for y to decrease as x increases, we say that there is a negative association between the two variables. Does the height and maximum speed of a roller coaster appear to have a positive or negative association? There is a negative association between the height and maximum speed of a roller coaster There is a positive association between the height and maximam speed of a roller coaster 80 FF $ A F4 5 # ^ 6 F6 & 7 8 D 1 pts . 8 DI O 1 pts DD Below is a small portion of the table that lists the roller coaster at Cedar Point. The Raptor is taller than the Gemini but it's maximum speed is less. Does this mean that there is a negative association between the height and maximum speed for all the roller coasters? Coaster Blue Streak Gemini Magnum Mantis Mean Streak Millennium Force Raptor 137 Top Thrill Dragster 120 420 Wicked Twister 72 215 This shows that there must not be an association at all. The Mean Streak is taller and faster than the Mantis, which is a positive association. So sometimes taller coasters are faster and sometimes they are slower. Question 6 Speed Height 40 78 60 125 72 205 60 145 65 161 93 310 57 This does not mean that there is a negative association. The trend in the scatterplot shows a positive association. There may be exceptions to the overall pattern. 22 [Select] [Select] Make another scatterplot to see if newer roller coasters are faster than older roller coasters. For this scatterplot you would use the year the roller coaster was opened (Opened) for the [Select] variable and Speed for the [Select] 2 pts of roller coasters have a stronger association than the of the coasters. variable. In this lab we will be investigating the relationship between the height of a roller coaster and its speed. Suppose we are interested in the question; Does the height of the roller coaster relate to the maximum speed of the coaster? Choose the best answer based on what you think the relationship between the height and speed of the coaster will be. This question is not worth any points so you won't lose points if you get the wrong answer. Roller coasters that are taller wi will tend to travel slower. There is no relationship between the height of the roller coaster and the maximum speed of the coaster Roller coasters that are taller will tend to travel faster. There will be a relationship between height and maximum speed of the coaster but you can't tell how the speed will change as the height of the coaster increases. Question 2 Open the data for Roller Coasters BGSU e. If the link doesn't work to open the data StatCrunch then search for data sets owned by math1150. Click on Data Sets in the Data column in the home page, and then in the search box type math1150 1 pts A common graph used to examine relationships between quantitative variables is the scatterplot. If we suspect that one variable may help explain what is happening with the other variable, then we let x be the explanatory variable and graph it on the horizontal axis and let y be the response variable and graph it on the vertical axis. Remember the question we are interested in answering is: Does the height of the roller coaster relate to the maximum speed of the coaster? To answer this question we let height of the roller coaster maximum speed of the ruller o be the response variable. 1 be the explanatory variable and @ 2 # 2 Question 3 Below are the steps for constructing a scatterplot in StatCrunch. From the Graph menu choose Scatter Plot . Using the drop down menus choose the explanatory variable for your x column and the response variable for your y column. (For this example the explanatory variable is the height and the response variable is the speed of the roller coaster) . Click on Compute! Does the scatterplot suggest that there is a relationship between the height of the roller coaster and the maximum speed of the coaster? If so, describe what the scatterplot tells you about this relationship. There is a no straight-line relationship between the two variables. As the height of the coaster increases you can't tell what will happen to the maximum speed of the roller coaster If There is a straight-line relationship between the two variables. As the height of the coaster increases so does the maximum speed. There is a straight-line relationship between the two variables. As the height of the coaster increases the maximum speed decreases Question 4 in a scatterplot is for y to increase as x increases, we say that there is a positive association between the two variables. Similarly, if the trend in a scatterplot is for y to decrease as x increases, we say that there is a negative association between the two variables. Does the height and maximum speed of a roller coaster appear to have a positive or negative association? There is a negative association between the height and maximum speed of a roller coaster There is a positive association between the height and maximam speed of a roller coaster 80 FF $ A F4 5 # ^ 6 F6 & 7 8 D 1 pts . 8 DI O 1 pts DD Below is a small portion of the table that lists the roller coaster at Cedar Point. The Raptor is taller than the Gemini but it's maximum speed is less. Does this mean that there is a negative association between the height and maximum speed for all the roller coasters? Coaster Blue Streak Gemini Magnum Mantis Mean Streak Millennium Force Raptor 137 Top Thrill Dragster 120 420 Wicked Twister 72 215 This shows that there must not be an association at all. The Mean Streak is taller and faster than the Mantis, which is a positive association. So sometimes taller coasters are faster and sometimes they are slower. Question 6 Speed Height 40 78 60 125 72 205 60 145 65 161 93 310 57 This does not mean that there is a negative association. The trend in the scatterplot shows a positive association. There may be exceptions to the overall pattern. 22 [Select] [Select] Make another scatterplot to see if newer roller coasters are faster than older roller coasters. For this scatterplot you would use the year the roller coaster was opened (Opened) for the [Select] variable and Speed for the [Select] 2 pts of roller coasters have a stronger association than the of the coasters. variable.
Expert Answer:
Answer rating: 100% (QA)
The scatterplot suggests that there is a positive relationship between the height of the roller coaster and the maximum speed of the coaster As the height of the coaster increases the maximum speed al... View the full answer

Related Book For 

Stats Data and Models
ISBN: 978-0321986498
4th edition
Authors: Richard D. De Veaux, Paul D. Velleman, David E. Bock
Posted Date:
Students also viewed these accounting questions
-
This graph shows the relationship between the height of some high-rise buildings and the number of stories in those buildings. A line is drawn to fit the data. a. Estimate the slope. What is the...
-
Question 5 Use logarithm differentiation techniques to determine the y' of the following functions: 5.1 y = 5.2 y = (In(-x)) (cos(3-x)) x sin(-3x-1) sin(-2t) 53t e-31 . (4) (4)
-
The following graph shows the position of a roller coaster as a function of time. When is the roller coaster going most quickly? When is it accelerating most quickly? When is it decelerating most...
-
Write the nodal equations for the networks in Figure. Using determinants, solve for the nodal vo ltages. R4 2 5 A R 1 R3 50 4 3 A
-
The Love Company has provided the following information: Income tax rate .......... 30% Selling price per unit.........$6.60 Variable cost per unit.........$5.28 Total fixed costs ..............
-
Which solute would provide the sharper end point in a titration with 0.10 M HCl: (a) 0.10 M NaOCl or 0.10 M hydroxylamine? (b) 0.10 M methylamine or 0.10 M hydroxylamine?
-
Compute the missing amounts in the following financial statements. You may assume that accounts receivable relate only to credit sales and that accounts payable relate only to credit purchases of...
-
The following information is available for Sunset Valley Hotel for July 2013: The following is a list of checks and deposits recorded on the books of the Sunset Valley Hotel for July 2013: Other...
-
Meiji Isetan Corporation of Japan has two regional divisions with headquarters in Osaka and Yokohama. Selected data on the two divisions follow: Sales Net operating income Average operating assets...
-
TechGlobe Inc. is a leading technology company specializing in software development. Lisa, the CEO of TechGlobe, has identified a potential acquisition opportunity in the market. The target firm,...
-
This memo is to inform you that the team has compiled the basic fundamentals of the accounting procedure, and we have noted that there is a serious concern we have identified in column D of the Excel...
-
In the text we introduced you to two levels of assurance. Explain what is meant by assurance, illustrating your answer by reference to these levels of assurance.
-
Implement a rule-based or frame-based expert system shell in the programming language of your choice. Implement an expert system in your expert system shell to solve problems in an area in which you...
-
Identify important controls surrounding inventory counts by the entity.
-
Explain why it is so important for auditors to identify the points at which management is making judgemental decisions about accounting matters. Give examples.
-
a. Draw three points on a circle. How many triangles can you draw using these points as vertices? b. Draw four points on a circle. How many triangles can you draw by using any three of these points...
-
How Aviation Safety Action Program (ASAP) and Flight Operations Quality Assurance (FOQA) programs make an air carrier safer?
-
Eleni Cabinet Company sold 2,200 cabinets during 2011 at $160 per cabinet. Its beginning inventory on January 1 was 130 cabinets at $56. Purchases made during the year were as follows: February . 225...
-
Among a group of disabled women aged 65 and older who were tracked for several years, those who had a vitamin B12 deficiency were twice as likely to suffer severe depression as those who did not....
-
Here are some diagnostic plots for the final exam data from Exercise 13. These were generated by a computer package and may look different from the plots generated by the packages you use. (In...
-
A company held a blood pressure screening clinic for its employees. The results are summarized in the table below by age group and blood pressure level: a) Find the marginal distribution of blood...
-
Refer to the data given for the Pruitt Company in Problem P12-3A. Required a. Compute the change in cash that occurred in 2019. b. Prepare a statement of cash flows using the direct method. Use one...
-
Refer to the data given for the North Company in Problem P12-2A a. Calculate the change in cash that occurred during 2019. b. Prepare a statement of cash flows using the direct method. Problem P12-2A...
-
Refer to the data given for the Sky Company in Problem P12-4A. Required a. Calculate the change in cash that occurred in 2019. b. Prepare a statement of cash flows using the direct method. Use one...

Study smarter with the SolutionInn App