

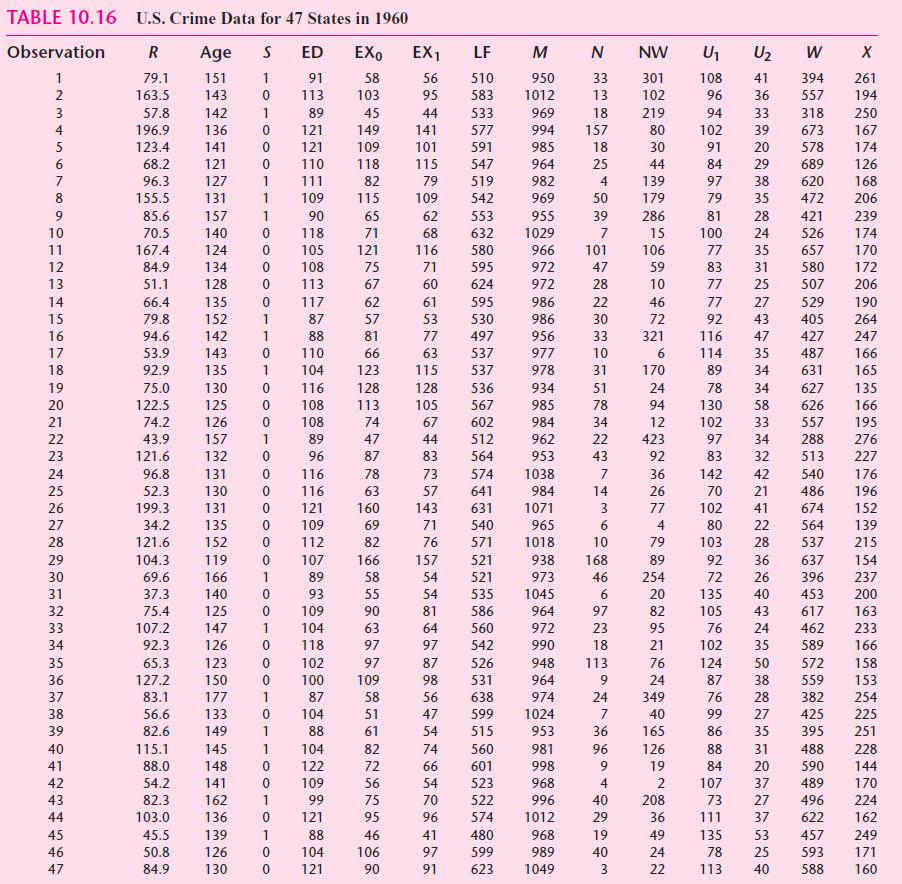
Table 10.16 gives data on the crime rate in 47 states in the United States for 1960.
Fantastic news! We've Found the answer you've been seeking!
Question:
Table 10.16 gives data on the crime rate in 47 states in the United States for 1960.
Try to develop a suitable model to explain the crime rate in relation to the 14
socioeconomic variables given in the table. Pay particular attention to the collinearity
problem in developing your model
Expert Answer:
Here The crime rate is R The number of males aged 424 years per 1000 population is AGE The indicator ... View the full answer

Related Book For 

Posted Date:
