

The client has provided you with the calculations below, and asked you to determine whether an...
Fantastic news! We've Found the answer you've been seeking!
Question:
Transcribed Image Text:
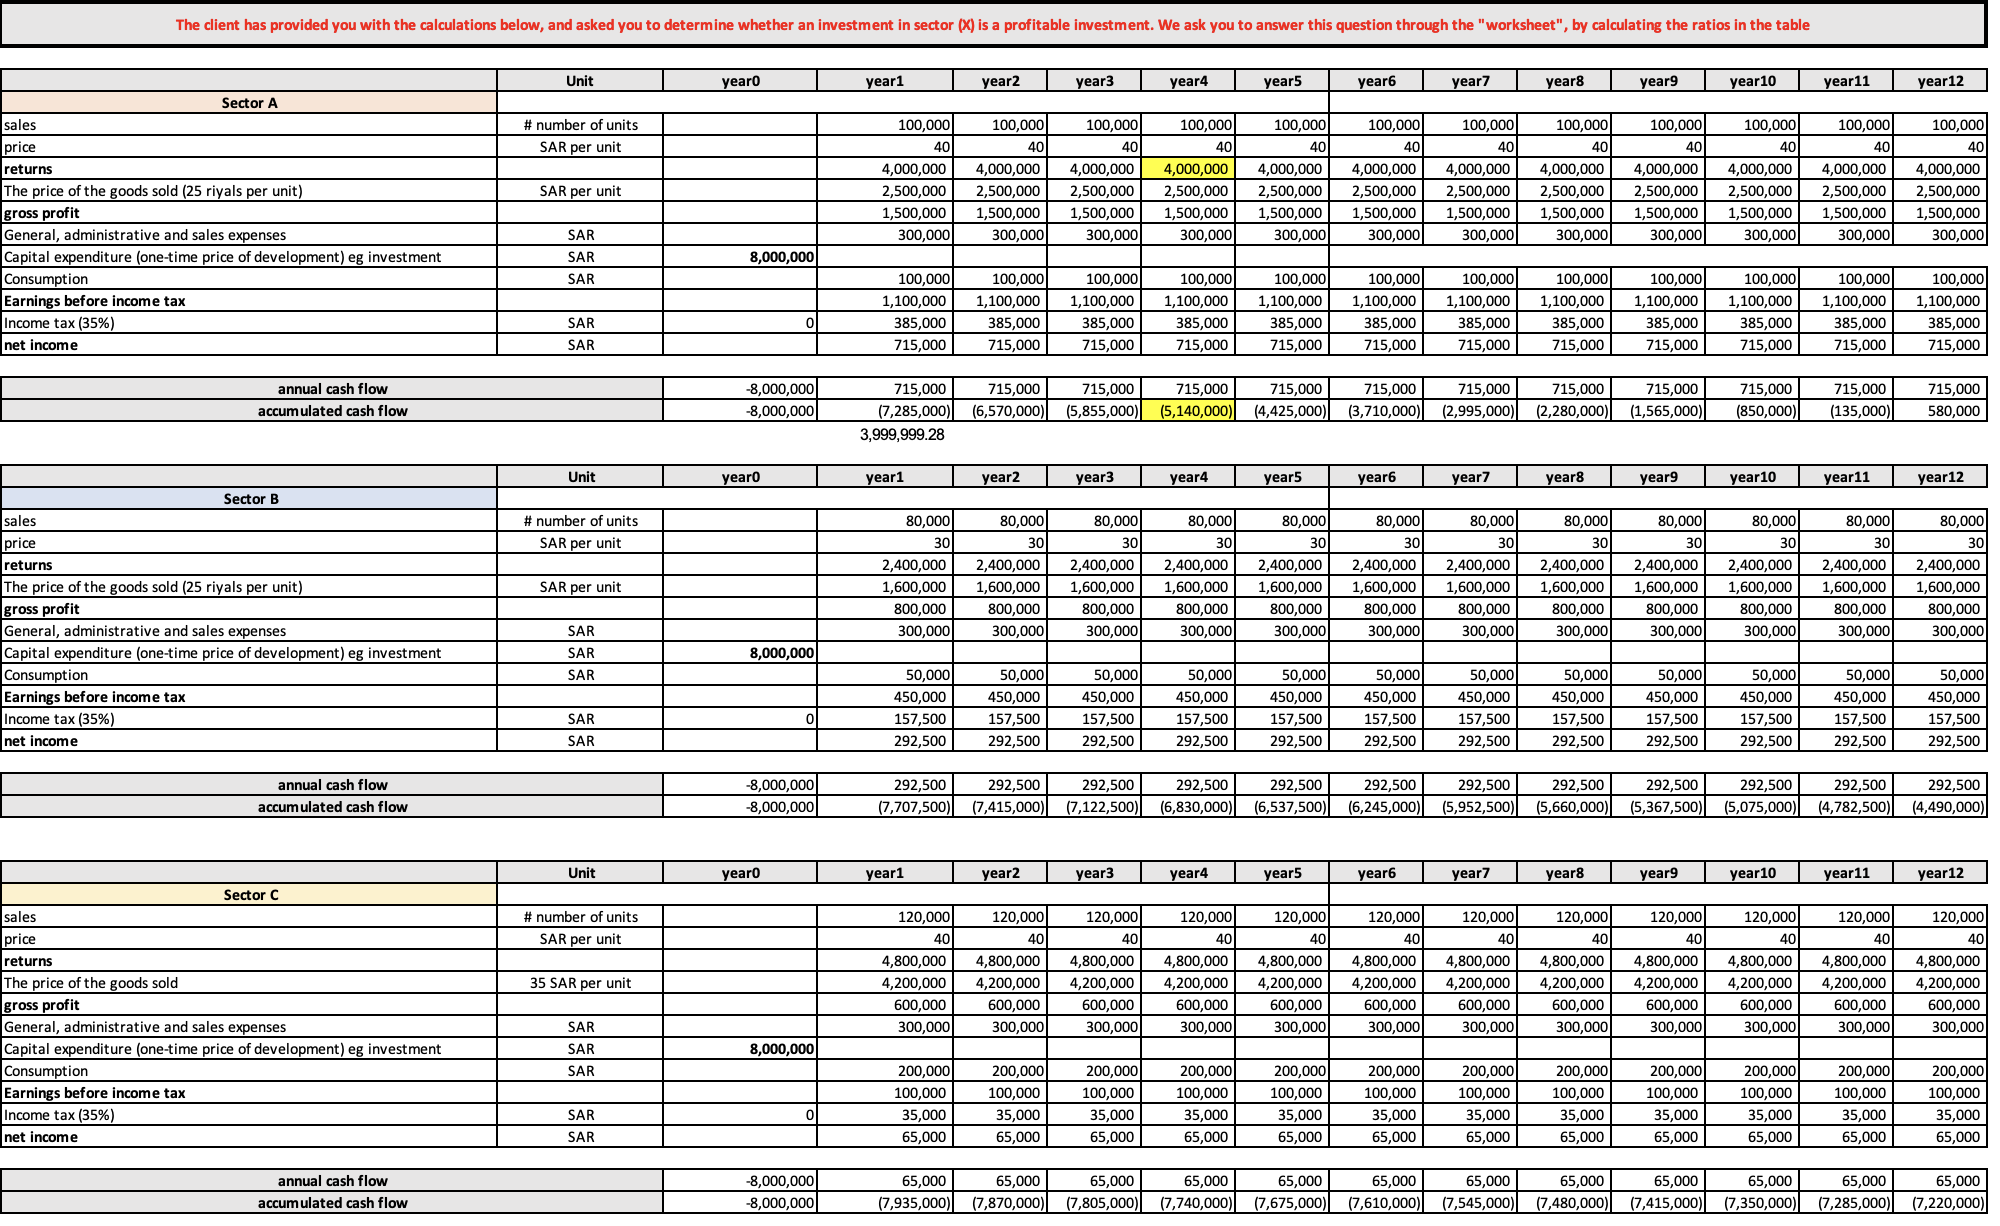
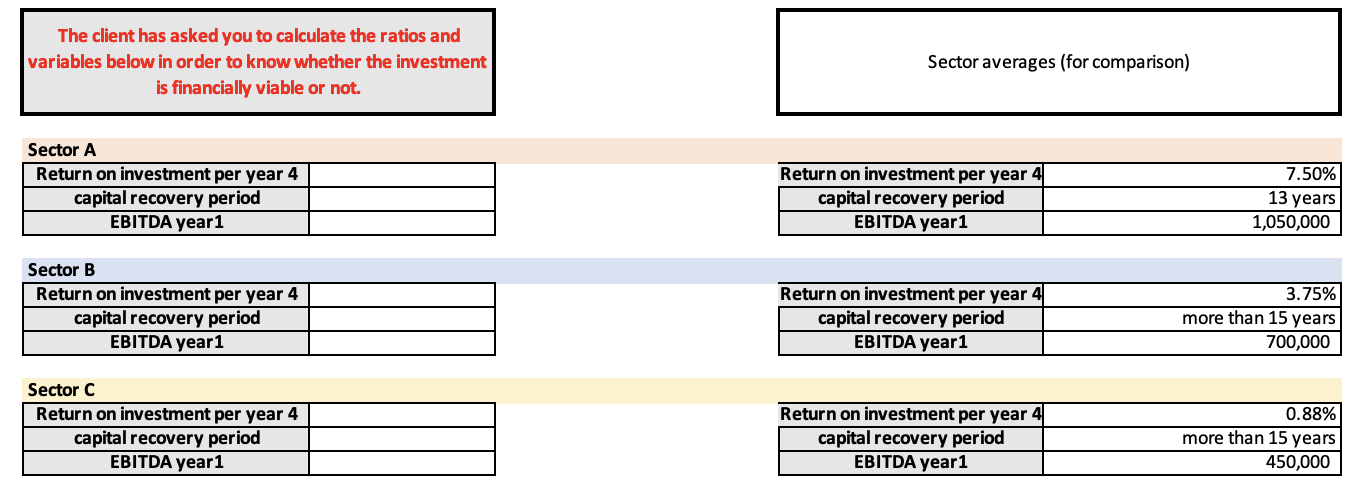
The client has provided you with the calculations below, and asked you to determine whether an investment in sector (X) is a profitable investment. We ask you to answer this question through the "worksheet", by calculating the ratios in the table Sector A sales price returns The price of the goods sold (25 riyals per unit) gross profit General, administrative and sales expenses Capital expenditure (one-time price of development) eg investment Consumption Earnings before income tax Income tax (35%) net income sales price returns annual cash flow accumulated cash flow Sector B sales price returns The price of the goods sold (25 riyals per unit) gross profit General, administrative and sales expenses Capital expenditure (one-time price of development) eg investment Consumption Earnings before income tax Income tax (35%) net income annual cash flow accumulated cash flow Sector C The price of the goods sold gross profit General, administrative and sales expenses Capital expenditure (one-time price of development) eg investment Consumption Earnings before income tax Income tax (35%) net income annual cash flow accumulated cash flow Unit # number of units SAR per unit SAR per unit SAR SAR SAR SAR SAR Unit # number of units SAR per unit SAR per unit SAR SAR SAR SAR SAR Unit # number of units SAR per unit 35 SAR per unit SAR SAR SAR SAR SAR year0 8,000,000 -8,000,000 -8,000,000 year0 0 8,000,000 year0 0 -8,000,000 -8,000,000 8,000,000 0 -8,000,000 -8,000,000 year1 100,000 40 year1 100,000 100,000 100,000 1,100,000 1,100,000 1,100,000 385,000 385,000 385,000 715,000 715,000 715,000 80,000 30 year2 50,000 450,000 157,500 292,500 100,000 40 ear1 4,000,000 4,000,000 4,000,000 4,000,000 4,000,000 2,500,000 2,500,000 2,500,000 2,500,000 2,500,000 1,500,000 1,500,000 1,500,000 1,500,000 1,500,000 300,000 300,000 300,000 300,000 300,000 120,000 40 year2 200,000 100,000 35,000 65,000 80,000 30 year3 100,000 40 715,000 715,000 715,000 715,000 715,000 715,000 (7,285,000) (6,570,000) (5,855,000) (5,140,000) (4,425,000) (3,710,000) 3,999,999.28 50,000 450,000 157,500 292,500 120,000 40 292,500 292,500 292,500 (7,707,500) (7,415,000) (7,122,500) year3 200,000 100,000 35,000 65,000 80,000 30 50,000 450,000 157,500 292,500 4,800,000 4,800,000 4,800,000 4,200,000 4,200,000 4,200,000 600,000 600,000 600,000 300,000 300,000 300,000 year4 120,000 40 100,000 40 200,000 100,000 35,000 65,000 year4 80,000 30 year5 100,000 40 100,000 100,000 100,000 1,100,000 1,100,000 1,100,000 385,000 385,000 385,000 715,000 715,000 715,000 50,000 450,000 157,500 292,500 120,000 40 year5 200,000 100,000 35,000 65,000 80,000 30 50,000 450,000 157,500 292,500 year5 year6 120,000 100,000 40 40 200,000 100,000 35,000 65,000 65,000 65,000 65,000 65,000 65,000 (7,935,000) (7,870,000) (7,805,000) (7,740,000) (7,675,000) year6 80,000 30 50,000 450,000 157,500 292,500 292,500 292,500 292,500 292,500 (6,830,000) (6,537,500) (6,245,000) (5,952,500) year7 year6 100,000 40 120,000 40 100,000 1,100,000 385,000 715,000 200,000 100,000 35,000 65,000 4,000,000 4,000,000 4,000,000 4,000,000 4,000,000 4,000,000 4,000,000 2,500,000 2,500,000 2,500,000 2,500,000 2,500,000 2,500,000 2,500,000 1,500,000 1,500,000 1,500,000 1,500,000 1,500,000 1,500,000 1,500,000 300,000 300,000 300,000 300,000 300,000 300,000 300,000 year7 2,400,000 2,400,000 2,400,000 2,400,000 2,400,000 2,400,000 2,400,000 2,400,000 2,400,000 2,400,000 2,400,000 2,400,000 1,600,000 1,600,000 1,600,000 1,600,000 1,600,000 1,600,000 1,600,000 1,600,000 1,600,000 1,600,000 1,600,000 1,600,000 800,000 800,000 800,000 800,000 300,000 300,000 300,000 800,000 300,000 800,000 300,000 800,000 300,000 800,000 300,000 800,000 300,000 800,000 300,000 800,000 300,000 800,000 300,000 300,000 80,000 30 50,000 450,000 157,500 292,500 year8 year7 100,000 40 120,000 40 100,000 1,100,000 385,000 715,000 200,000 100,000 35,000 65,000 715,000 715,000 715,000 715,000 715,000 (2,995,000) (2,280,000) (1,565,000) (850,000) (135,000) year8 80,000 30 50,000 450,000 157,500 292,500 year9 100,000 40 ear8 120,000 40 200,000 100,000 35,000 65,000 year9 80,000 30 year10 50,000 450,000 157,500 292,500 100,000 40 100,000 100,000 100,000 100,000 1,100,000 1,100,000 1,100,000 1,100,000 385,000 385,000 385,000 385,000 715,000 715,000 715,000 715,000 ar9 120,000 40 year10 200,000 100,000 35,000 65,000 80,000 30 year11 50,000 450,000 157,500 292,500 292,500 292,500 292,500 292,500 (5,660,000) (5,367,500) (5,075,000) (4,782,500) 100,000 40 year10 120,000 40 year11 200,000 100,000 35,000 65,000 80,000 30 50,000 450,000 157,500 292,500 year12 ar11 100,000 40 120,000 40 4,800,000 4,800,000 4,800,000 4,800,000 4,800,000 4,800,000 4,800,000 4,800,000 4,800,000 4,200,000 4,200,000 4,200,000 4,200,000 4,200,000 4,200,000 4,200,000 600,000 600,000 600,000 600,000 600,000 300,000 4,200,000 4,200,000 600,000 600,000 600,000 300,000 600,000 300,000 300,000 300,000 300,000 300,000 300,000 300,000 200,000 100,000 35,000 65,000 715,000 580,000 year12 80,000 30 50,000 450,000 157,500 292,500 292,500 (4,490,000) ar12 120,000 40 200,000 100,000 35,000 65,000 65,000 65,000 65,000 65,000 65,000 65,000 65,000 (7,610,000) (7,545,000) (7,480,000) (7,415,000)| (7,350,000) (7,285,000) (7,220,000) The client has asked you to calculate the ratios and variables below in order to know whether the investment is financially viable or not. Sector A Return on investment per year 4 capital recovery period EBITDA year1 Sector B Return on investment per year 4 capital recovery period EBITDA year1 Sector C Return on investment per year 4 capital recovery period EBITDA year1 Sector averages (for comparison) Return on investment per year 4 capital recovery period EBITDA year1 Return on investment per year 4 capital recovery period EBITDA year1 Return on investment per year 4 capital recovery period EBITDA year1 7.50% 13 years 1,050,000 3.75% more than 15 years 700,000 0.88% more than 15 years 450,000 The client has provided you with the calculations below, and asked you to determine whether an investment in sector (X) is a profitable investment. We ask you to answer this question through the "worksheet", by calculating the ratios in the table Sector A sales price returns The price of the goods sold (25 riyals per unit) gross profit General, administrative and sales expenses Capital expenditure (one-time price of development) eg investment Consumption Earnings before income tax Income tax (35%) net income sales price returns annual cash flow accumulated cash flow Sector B sales price returns The price of the goods sold (25 riyals per unit) gross profit General, administrative and sales expenses Capital expenditure (one-time price of development) eg investment Consumption Earnings before income tax Income tax (35%) net income annual cash flow accumulated cash flow Sector C The price of the goods sold gross profit General, administrative and sales expenses Capital expenditure (one-time price of development) eg investment Consumption Earnings before income tax Income tax (35%) net income annual cash flow accumulated cash flow Unit # number of units SAR per unit SAR per unit SAR SAR SAR SAR SAR Unit # number of units SAR per unit SAR per unit SAR SAR SAR SAR SAR Unit # number of units SAR per unit 35 SAR per unit SAR SAR SAR SAR SAR year0 8,000,000 -8,000,000 -8,000,000 year0 0 8,000,000 year0 0 -8,000,000 -8,000,000 8,000,000 0 -8,000,000 -8,000,000 year1 100,000 40 year1 100,000 100,000 100,000 1,100,000 1,100,000 1,100,000 385,000 385,000 385,000 715,000 715,000 715,000 80,000 30 year2 50,000 450,000 157,500 292,500 100,000 40 ear1 4,000,000 4,000,000 4,000,000 4,000,000 4,000,000 2,500,000 2,500,000 2,500,000 2,500,000 2,500,000 1,500,000 1,500,000 1,500,000 1,500,000 1,500,000 300,000 300,000 300,000 300,000 300,000 120,000 40 year2 200,000 100,000 35,000 65,000 80,000 30 year3 100,000 40 715,000 715,000 715,000 715,000 715,000 715,000 (7,285,000) (6,570,000) (5,855,000) (5,140,000) (4,425,000) (3,710,000) 3,999,999.28 50,000 450,000 157,500 292,500 120,000 40 292,500 292,500 292,500 (7,707,500) (7,415,000) (7,122,500) year3 200,000 100,000 35,000 65,000 80,000 30 50,000 450,000 157,500 292,500 4,800,000 4,800,000 4,800,000 4,200,000 4,200,000 4,200,000 600,000 600,000 600,000 300,000 300,000 300,000 year4 120,000 40 100,000 40 200,000 100,000 35,000 65,000 year4 80,000 30 year5 100,000 40 100,000 100,000 100,000 1,100,000 1,100,000 1,100,000 385,000 385,000 385,000 715,000 715,000 715,000 50,000 450,000 157,500 292,500 120,000 40 year5 200,000 100,000 35,000 65,000 80,000 30 50,000 450,000 157,500 292,500 year5 year6 120,000 100,000 40 40 200,000 100,000 35,000 65,000 65,000 65,000 65,000 65,000 65,000 (7,935,000) (7,870,000) (7,805,000) (7,740,000) (7,675,000) year6 80,000 30 50,000 450,000 157,500 292,500 292,500 292,500 292,500 292,500 (6,830,000) (6,537,500) (6,245,000) (5,952,500) year7 year6 100,000 40 120,000 40 100,000 1,100,000 385,000 715,000 200,000 100,000 35,000 65,000 4,000,000 4,000,000 4,000,000 4,000,000 4,000,000 4,000,000 4,000,000 2,500,000 2,500,000 2,500,000 2,500,000 2,500,000 2,500,000 2,500,000 1,500,000 1,500,000 1,500,000 1,500,000 1,500,000 1,500,000 1,500,000 300,000 300,000 300,000 300,000 300,000 300,000 300,000 year7 2,400,000 2,400,000 2,400,000 2,400,000 2,400,000 2,400,000 2,400,000 2,400,000 2,400,000 2,400,000 2,400,000 2,400,000 1,600,000 1,600,000 1,600,000 1,600,000 1,600,000 1,600,000 1,600,000 1,600,000 1,600,000 1,600,000 1,600,000 1,600,000 800,000 800,000 800,000 800,000 300,000 300,000 300,000 800,000 300,000 800,000 300,000 800,000 300,000 800,000 300,000 800,000 300,000 800,000 300,000 800,000 300,000 800,000 300,000 300,000 80,000 30 50,000 450,000 157,500 292,500 year8 year7 100,000 40 120,000 40 100,000 1,100,000 385,000 715,000 200,000 100,000 35,000 65,000 715,000 715,000 715,000 715,000 715,000 (2,995,000) (2,280,000) (1,565,000) (850,000) (135,000) year8 80,000 30 50,000 450,000 157,500 292,500 year9 100,000 40 ear8 120,000 40 200,000 100,000 35,000 65,000 year9 80,000 30 year10 50,000 450,000 157,500 292,500 100,000 40 100,000 100,000 100,000 100,000 1,100,000 1,100,000 1,100,000 1,100,000 385,000 385,000 385,000 385,000 715,000 715,000 715,000 715,000 ar9 120,000 40 year10 200,000 100,000 35,000 65,000 80,000 30 year11 50,000 450,000 157,500 292,500 292,500 292,500 292,500 292,500 (5,660,000) (5,367,500) (5,075,000) (4,782,500) 100,000 40 year10 120,000 40 year11 200,000 100,000 35,000 65,000 80,000 30 50,000 450,000 157,500 292,500 year12 ar11 100,000 40 120,000 40 4,800,000 4,800,000 4,800,000 4,800,000 4,800,000 4,800,000 4,800,000 4,800,000 4,800,000 4,200,000 4,200,000 4,200,000 4,200,000 4,200,000 4,200,000 4,200,000 600,000 600,000 600,000 600,000 600,000 300,000 4,200,000 4,200,000 600,000 600,000 600,000 300,000 600,000 300,000 300,000 300,000 300,000 300,000 300,000 300,000 200,000 100,000 35,000 65,000 715,000 580,000 year12 80,000 30 50,000 450,000 157,500 292,500 292,500 (4,490,000) ar12 120,000 40 200,000 100,000 35,000 65,000 65,000 65,000 65,000 65,000 65,000 65,000 65,000 (7,610,000) (7,545,000) (7,480,000) (7,415,000)| (7,350,000) (7,285,000) (7,220,000) The client has asked you to calculate the ratios and variables below in order to know whether the investment is financially viable or not. Sector A Return on investment per year 4 capital recovery period EBITDA year1 Sector B Return on investment per year 4 capital recovery period EBITDA year1 Sector C Return on investment per year 4 capital recovery period EBITDA year1 Sector averages (for comparison) Return on investment per year 4 capital recovery period EBITDA year1 Return on investment per year 4 capital recovery period EBITDA year1 Return on investment per year 4 capital recovery period EBITDA year1 7.50% 13 years 1,050,000 3.75% more than 15 years 700,000 0.88% more than 15 years 450,000
Expert Answer:
Answer rating: 100% (QA)
Profitability Analysis of Investment in Sector 00 Based on the provided information lets analyze the profitability of an investment in Sector 00 compa... View the full answer

Related Book For 

Auditing A Practical Approach
ISBN: 9780730382645
4th Edition
Authors: Robyn Moroney, Fiona Campbell, Jane Hamilton
Posted Date:
Students also viewed these accounting questions
-
10 25. Given the circuit below, label the inputs appropriately (Io through I7) so that the circuit performs the proper function of an 8 to 1 MUX. 0 2-to-1 MUX, 8-to-1 MUX D 26. 1 S 0 2-to-1 MUX 0...
-
The Crazy Eddie fraud may appear smaller and gentler than the massive billion-dollar frauds exposed in recent times, such as Bernie Madoffs Ponzi scheme, frauds in the subprime mortgage market, the...
-
You meet with the partner, Aram Anzari, who has instructions for a special personal tax return to prepare. Aram asks you to prepare the 2017 tax returns for his good friends Kathy and Kevin Dhaliwal....
-
Let a function f be the line graph connecting the data points (1, 2), (4,9), and (6,3). (a) Write the formula for a piecewise-linear function f that passes through these data points whose domain is 1...
-
An ac generator has a frequency of 2.2 kHz and a voltage of 240 V. An inductance L1 = 6.0 mH is connected across its terminals. Then a second inductance L2 = 9.0 mH is connected in parallel with L1....
-
(i) Why are accountants required to produce financial information? (ii) Who do they produce it for and what do they do with it?
-
Harwood Company is a manufacturer that operates a job-order costing system. Overhead costs are applied to jobs on the basis of machine-hours. At the beginning of the year, management estimated that...
-
CFG Company has the following employees: Wages Paid Eddie $12,000 Melanie 6,000 Shelly 22,000 CFG receives the maximum credit for state unemployment taxes. What is the FUTA tax that CFG Company would...
-
4. In AABC, the mLB = 90 tan(A) = . What is cos(C)? (A) (B) 3/3 (C) (D) = 413 315 513 415
-
AD Enterprise was established in June 2023. During the first month of the operation of the business, these events and transactions occurred: June 1 Mr. AD invested $100,000 cash in exchange into the...
-
Determine the mark-up percentage on absorption cost.
-
What is the procedure for calculating an owner's end-of-year capital?
-
Is it true that every organisation has to move materials to support its operations? What do service companies like Internet service providers move? Give some examples from different types of...
-
The Manufacturing Overhead account has a $10,000 debit balance that is closed directly to Cost of Goods Sold. Which of the following statements is true? a. Actual manufacturing overhead was less than...
-
What are prime costs? How are they different than other manufacturing costs?
-
What information used to prepare an owners' equity statement is obtained from the partners' capital and drawing accounts?
-
Develop a complete public relations plan using the Parts and Steps of a Strategic Model .The final project must include all 10 components of the strategic model, written in detail and explanation....
-
Ball bearings are widely used in industrial applications. You work for an industrial food machinery manufacturer and your role is to design the driveshaft assembly on a new type of equipment that...
-
When an audit test reveals an error or exception, the auditor should: (a) Try to understand why the error or exception has occurred. (b) Consider increasing the sample size. (c) Consider additional...
-
Inspecting documents, such as an invoice for the purchase of fi xed assets, provides the auditor with evidence relevant to the: (a) Rights and obligations assertion, because the document will show...
-
The following client- prepared bank reconciliation is being examined by Zachary Kallick, CPA, during the examination of the financial statements of Simmons Company. Required: Items (a) through (e)...
-
Identify possible causes for (1) a favorable materials price variance; (2) an unfavorable materials price variance; (3) a favorable materials quantity variance; and (4) an unfavorable materials...
-
Standard cost variances can usually be broken down into two basic types of variances. Identify and describe these two types of variances.
-
Explain the net sales volume variance and list its components.

Study smarter with the SolutionInn App