

The following table shows some information on a variety of different vehicles. Using the information given...
Fantastic news! We've Found the answer you've been seeking!
Question:
Transcribed Image Text:
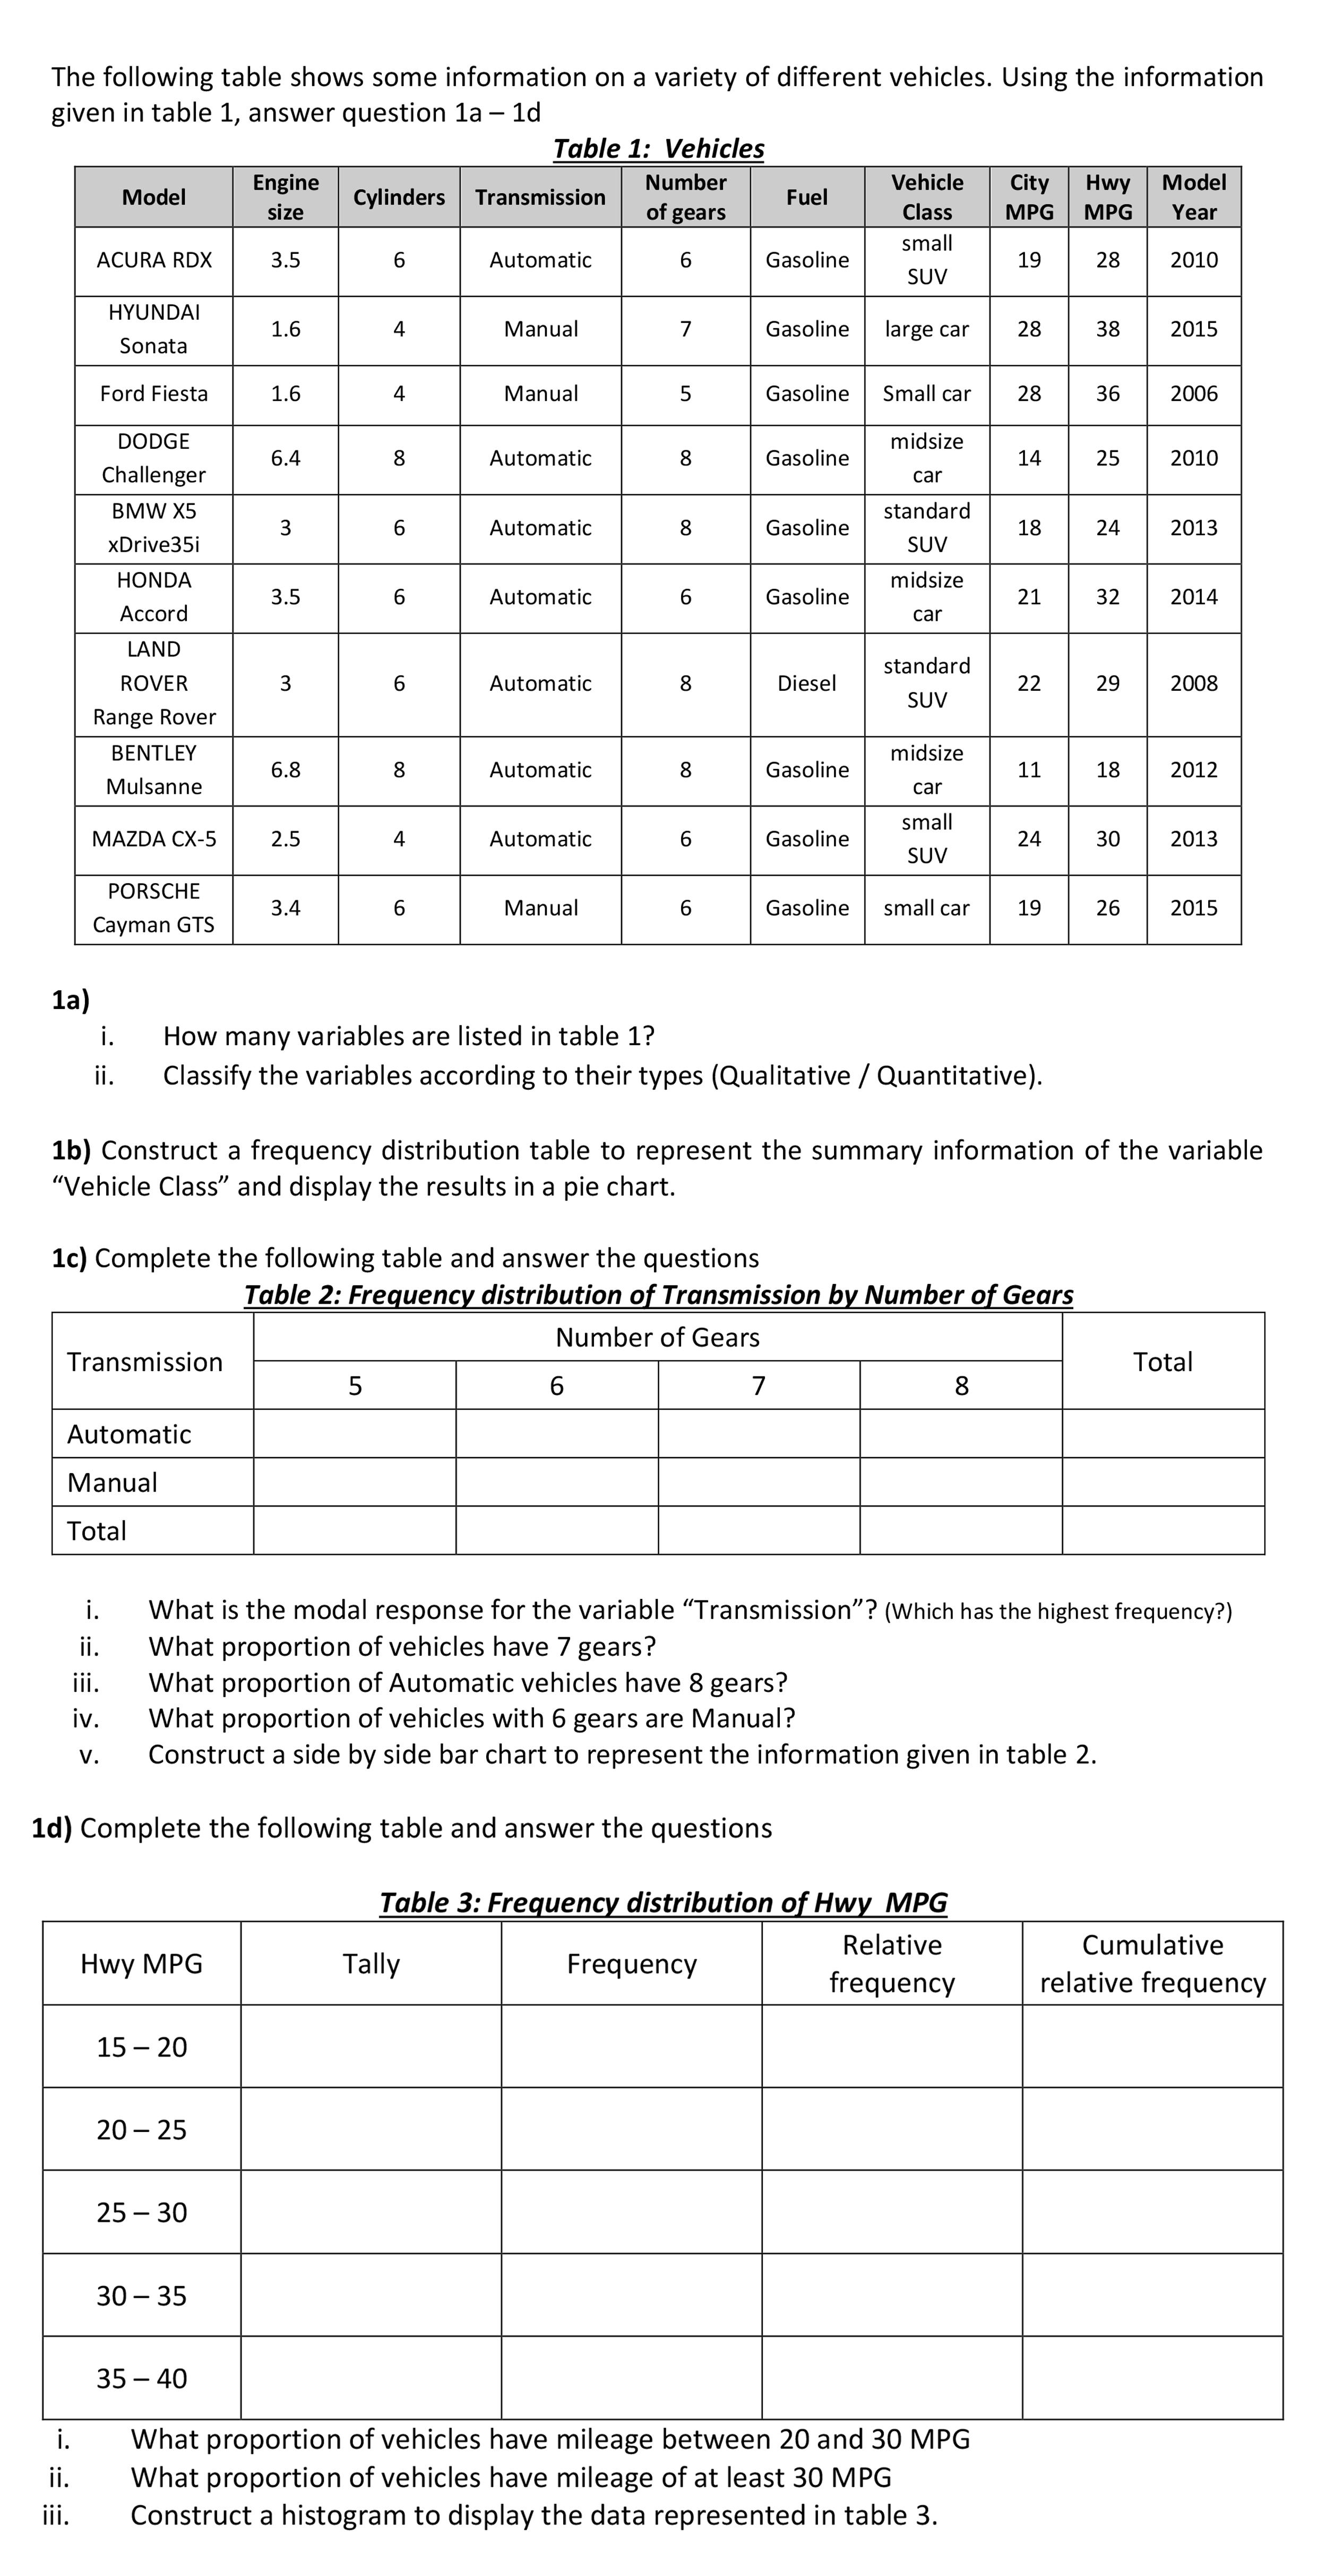
The following table shows some information on a variety of different vehicles. Using the information given in table 1, answer question 1a – 1d - Table 1: Vehicles Engine Number Vehicle City Hwy Model Model Cylinders Transmission Fuel size of gears Class MPG MPG Year small ACURA RDX 3.5 Automatic Gasoline 19 28 2010 SUV HYUNDAI 1.6 4 Manual 7 Gasoline large car 28 38 2015 Sonata Ford Fiesta 1.6 4 Manual Gasoline Small car 28 36 2006 DODGE midsize 6.4 8. Automatic 8. Gasoline 14 25 2010 Challenger car BMW X5 standard 3 6 Automatic 8 Gasoline 18 24 2013 xDrive35i SUV HONDA midsize 3.5 Automatic Gasoline 21 32 2014 Аccord car LAND standard ROVER 3 6. Automatic 8 Diesel 22 29 2008 SUV Range Rover BENTLEY midsize 6.8 8. Automatic 8 Gasoline 11 18 2012 Mulsanne car small MAZDA CX-5 2.5 4 Automatic Gasoline 24 30 2013 SUV PORSCHE 3.4 6. Manual Gasoline small car 19 26 2015 Cayman GTS 1a) i. How many variables are listed in table 1? ii. Classify the variables according to their types (Qualitative / Quantitative). 1b) Construct a frequency distribution table to represent the summary information of the variable "Vehicle Class" and display the results in a pie chart. 1c) Complete the following table and answer the questions Table 2: Frequency distribution of Transmission by Number of Gears Number of Gears Transmission Total 6. 7 8 Automatic Manual Total What is the modal response for the variable "Transmission"? (Which has the highest frequency?) What proportion of vehicles have 7 gears? What proportion of Automatic vehicles have 8 gears? What proportion of vehicles with 6 gears are Manual? Construct a side by side bar chart to represent the information given in table 2. i. i. ii. iv. V. 1d) Complete the following table and answer the questions Table 3: Frequency distribution of Hwy MPG Relative Cumulative Hwy MPG Tally Frequency frequency relative frequency 15 – 20 20 – 25 25 – 30 30 – 35 35 – 40 What proportion of vehicles have mileage between 20 and 30 MPG What proportion of vehicles have mileage of at least 30 MPG Construct a histogram to display the data represented in table 3. i. ii. ii. The following table shows some information on a variety of different vehicles. Using the information given in table 1, answer question 1a – 1d - Table 1: Vehicles Engine Number Vehicle City Hwy Model Model Cylinders Transmission Fuel size of gears Class MPG MPG Year small ACURA RDX 3.5 Automatic Gasoline 19 28 2010 SUV HYUNDAI 1.6 4 Manual 7 Gasoline large car 28 38 2015 Sonata Ford Fiesta 1.6 4 Manual Gasoline Small car 28 36 2006 DODGE midsize 6.4 8. Automatic 8. Gasoline 14 25 2010 Challenger car BMW X5 standard 3 6 Automatic 8 Gasoline 18 24 2013 xDrive35i SUV HONDA midsize 3.5 Automatic Gasoline 21 32 2014 Аccord car LAND standard ROVER 3 6. Automatic 8 Diesel 22 29 2008 SUV Range Rover BENTLEY midsize 6.8 8. Automatic 8 Gasoline 11 18 2012 Mulsanne car small MAZDA CX-5 2.5 4 Automatic Gasoline 24 30 2013 SUV PORSCHE 3.4 6. Manual Gasoline small car 19 26 2015 Cayman GTS 1a) i. How many variables are listed in table 1? ii. Classify the variables according to their types (Qualitative / Quantitative). 1b) Construct a frequency distribution table to represent the summary information of the variable "Vehicle Class" and display the results in a pie chart. 1c) Complete the following table and answer the questions Table 2: Frequency distribution of Transmission by Number of Gears Number of Gears Transmission Total 6. 7 8 Automatic Manual Total What is the modal response for the variable "Transmission"? (Which has the highest frequency?) What proportion of vehicles have 7 gears? What proportion of Automatic vehicles have 8 gears? What proportion of vehicles with 6 gears are Manual? Construct a side by side bar chart to represent the information given in table 2. i. i. ii. iv. V. 1d) Complete the following table and answer the questions Table 3: Frequency distribution of Hwy MPG Relative Cumulative Hwy MPG Tally Frequency frequency relative frequency 15 – 20 20 – 25 25 – 30 30 – 35 35 – 40 What proportion of vehicles have mileage between 20 and 30 MPG What proportion of vehicles have mileage of at least 30 MPG Construct a histogram to display the data represented in table 3. i. ii. ii.
Expert Answer:
Answer rating: 100% (QA)
solution la i 10 variables or features of interest ii QUALITA... View the full answer

Posted Date:
Students also viewed these mathematics questions
-
The Internal Revenue Service provides information on a variety of tax issues in its publication series. These publications can be found on the IRS World Wide Web site...
-
The Internal Revenue Service provides information on a variety of tax issues in its publication series. These publications can be found on the IRS Web site (www.irs.gov/formspubs/index.html). Go to...
-
Using the information given in P15- 1 and P15- 2, record the transactions in general journal form. Then, post the journal entries to ledger T- accounts, like those shown in Table 15- 11. (To help...
-
Walmart Stores has run into opposition when it has tried to open stores in certain towns in the United States. Walmarts capital budgeting process has determined that these locations would be...
-
Sportime Fitness Center, Inc., issued convertible bonds with a conversion price of $51. The bonds are available for immediate conversion. The current price of the companys common stock is $44 per...
-
Suppose that the J.C. Penney bond was issued at face value and that investors continue to demand a yield of 8.25%. Sketch what you think would happen to the bond price as the first interest payment...
-
Gloria Cosmetics uses a normal cost system and has the following balances at the end of its first years operations: Prepare journal entries for two different ways to dispose of the year-end overhead...
-
A General Power bond carries a coupon rate of 8%, has 9 years until maturity, and sells at a yield to maturity of 7%. (Assume annual interest payments.) a. What interest payments to bondholders...
-
A survey found the distribution of some families by size, and is as follows. Family Size 2 3 4 5 6 7 8 Frequency 87 50 61 31 16 3 2 Find the probability of family with 4 people. P(4) = [?]
-
1.Explain the types of conversion strategy options. Make a recommendation and highlight the choices as it reflects the cost, time, and risk associated with elements of the transition. Explain which...
-
Kayak Company budgeted the following cash receipts (excluding cash receipts from loans received) and cash payments (excluding cash payments for loan principal and interest payments) for the first...
-
List five sources from which expectations for analytical procedures may be developed.
-
Give two versions of the audit risk model
-
How the cam size is defined?
-
What are analytical procedures?
-
Differentiate between trace point and pitch point.
-
Consider the following income statement for the Luna Lighting Company for the year ended December 31, 2022 and the balance sheets for December 31, 2021 and 2022. Based on these statements, construct...
-
If a test has high reliability. O the test measures what the authors of the test claim it measures O people who take the same test twice get approximately the same scores both times O scores on the...
-
What are Porters generic strategies?
-
What is the link between the balanced scorecard and strategy?
-
How can the lifecycle approach be used to maximise return from a product?

Study smarter with the SolutionInn App