

The Specialty Department Stores, Inc. chief executive officer (CEO) has asked you to compare the company's...
Fantastic news! We've Found the answer you've been seeking!
Question:
Transcribed Image Text:
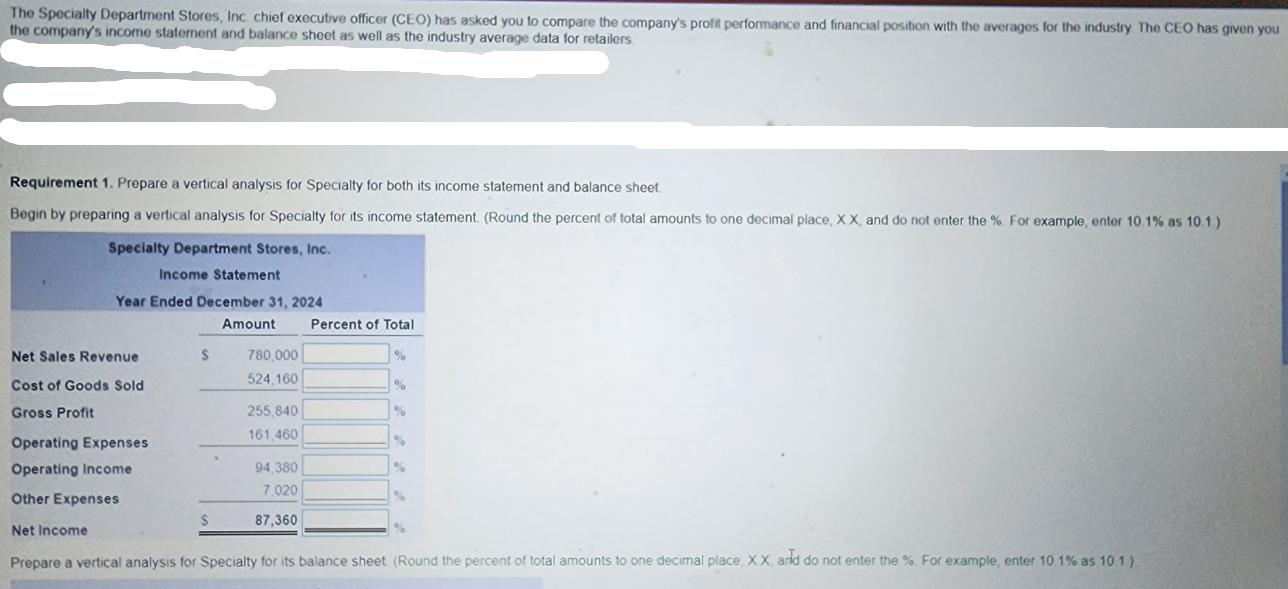
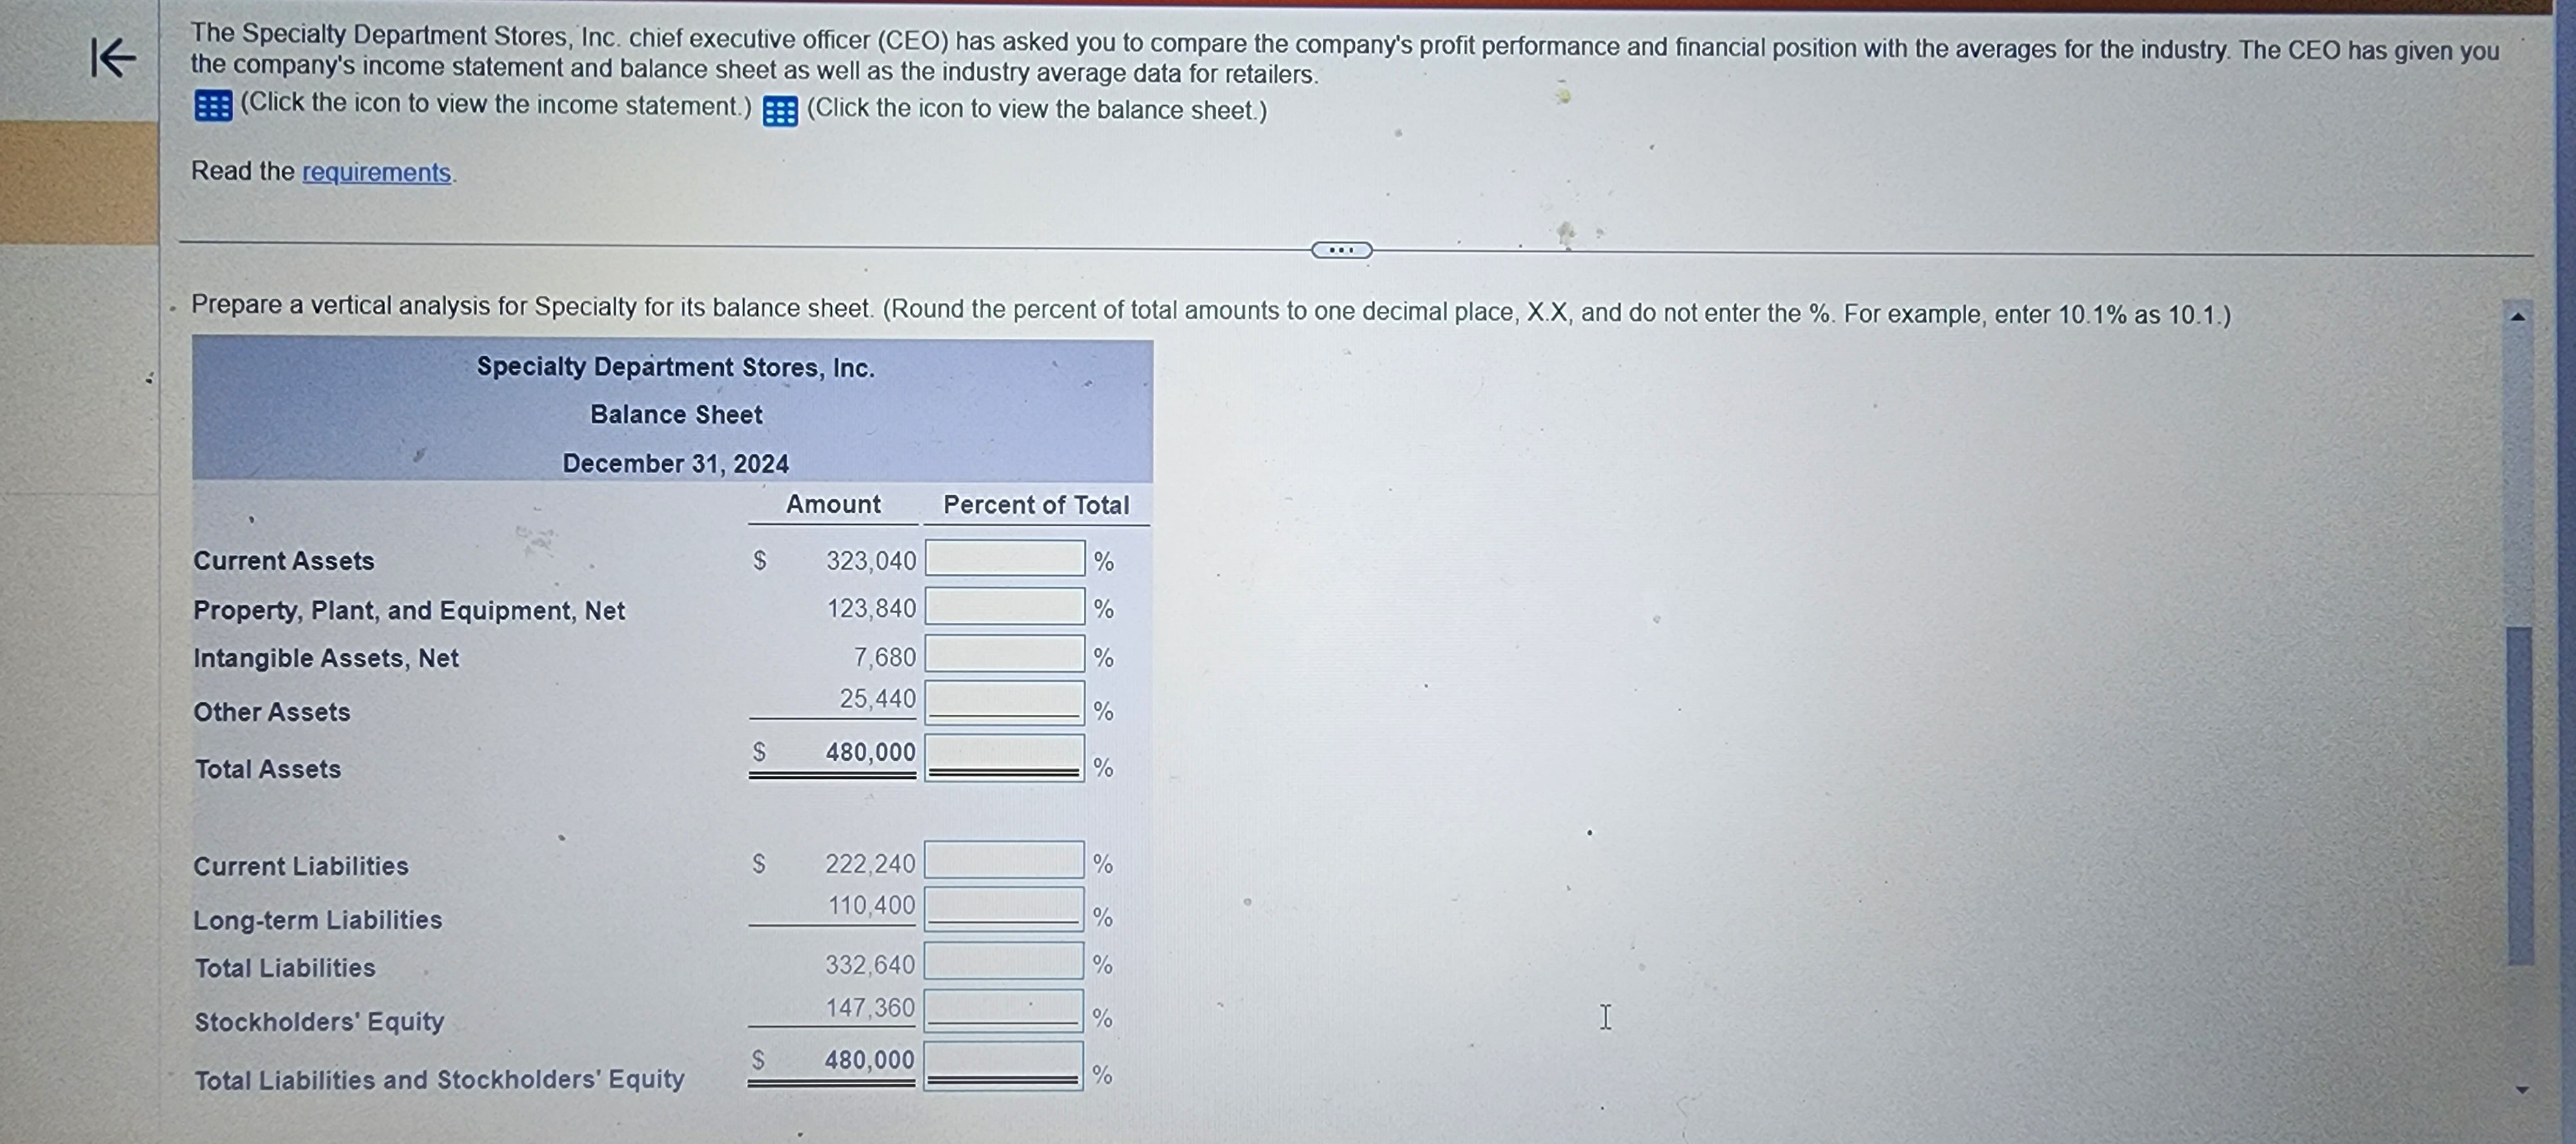
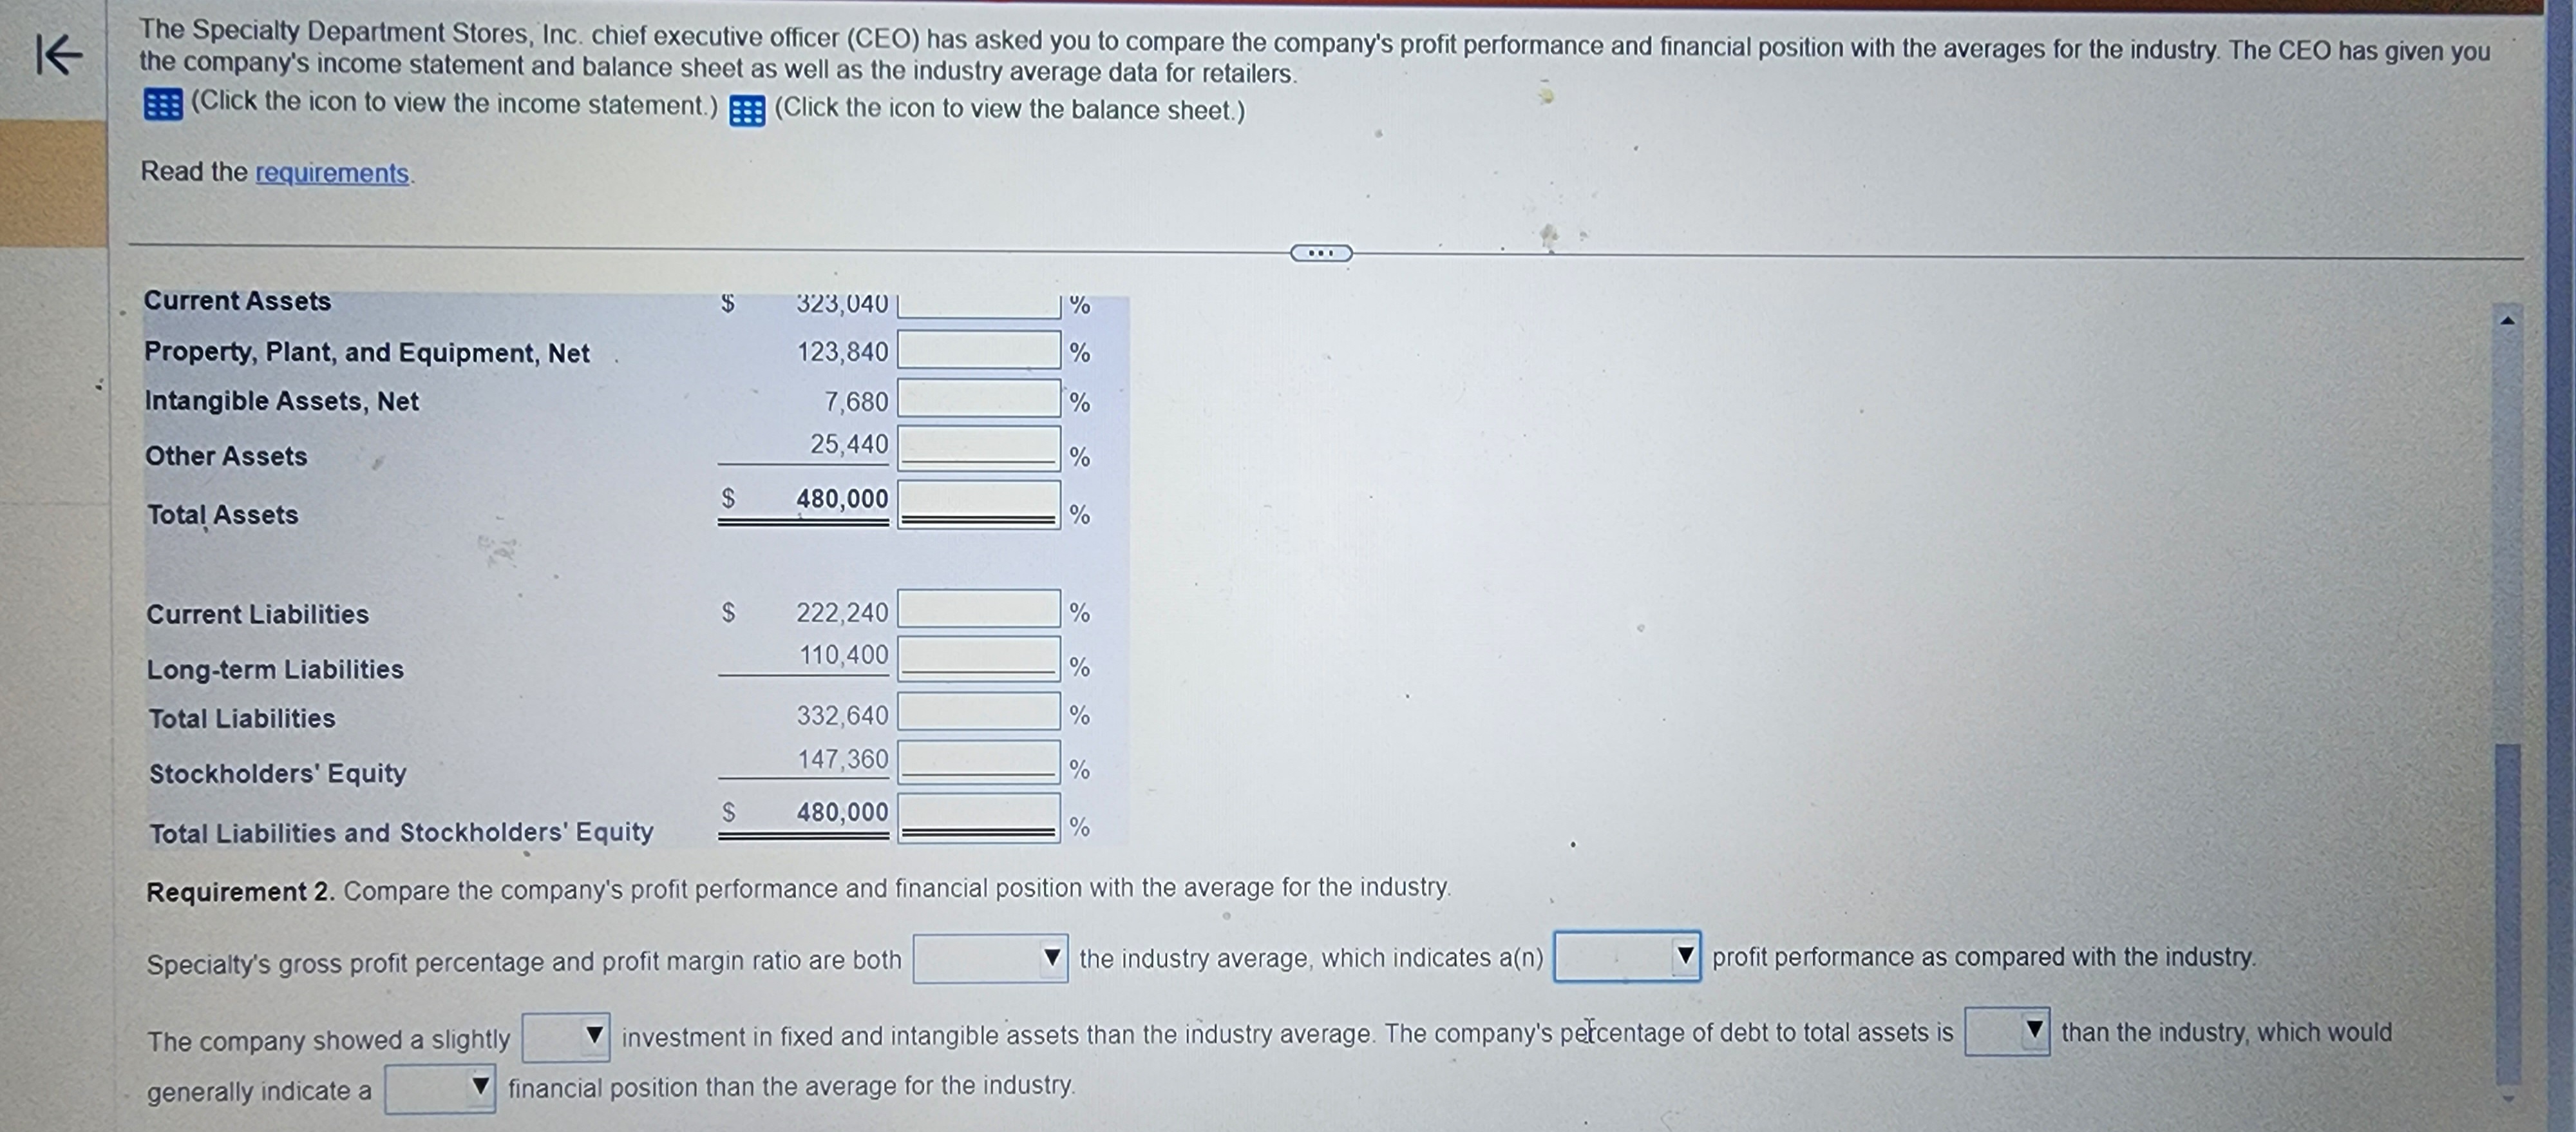
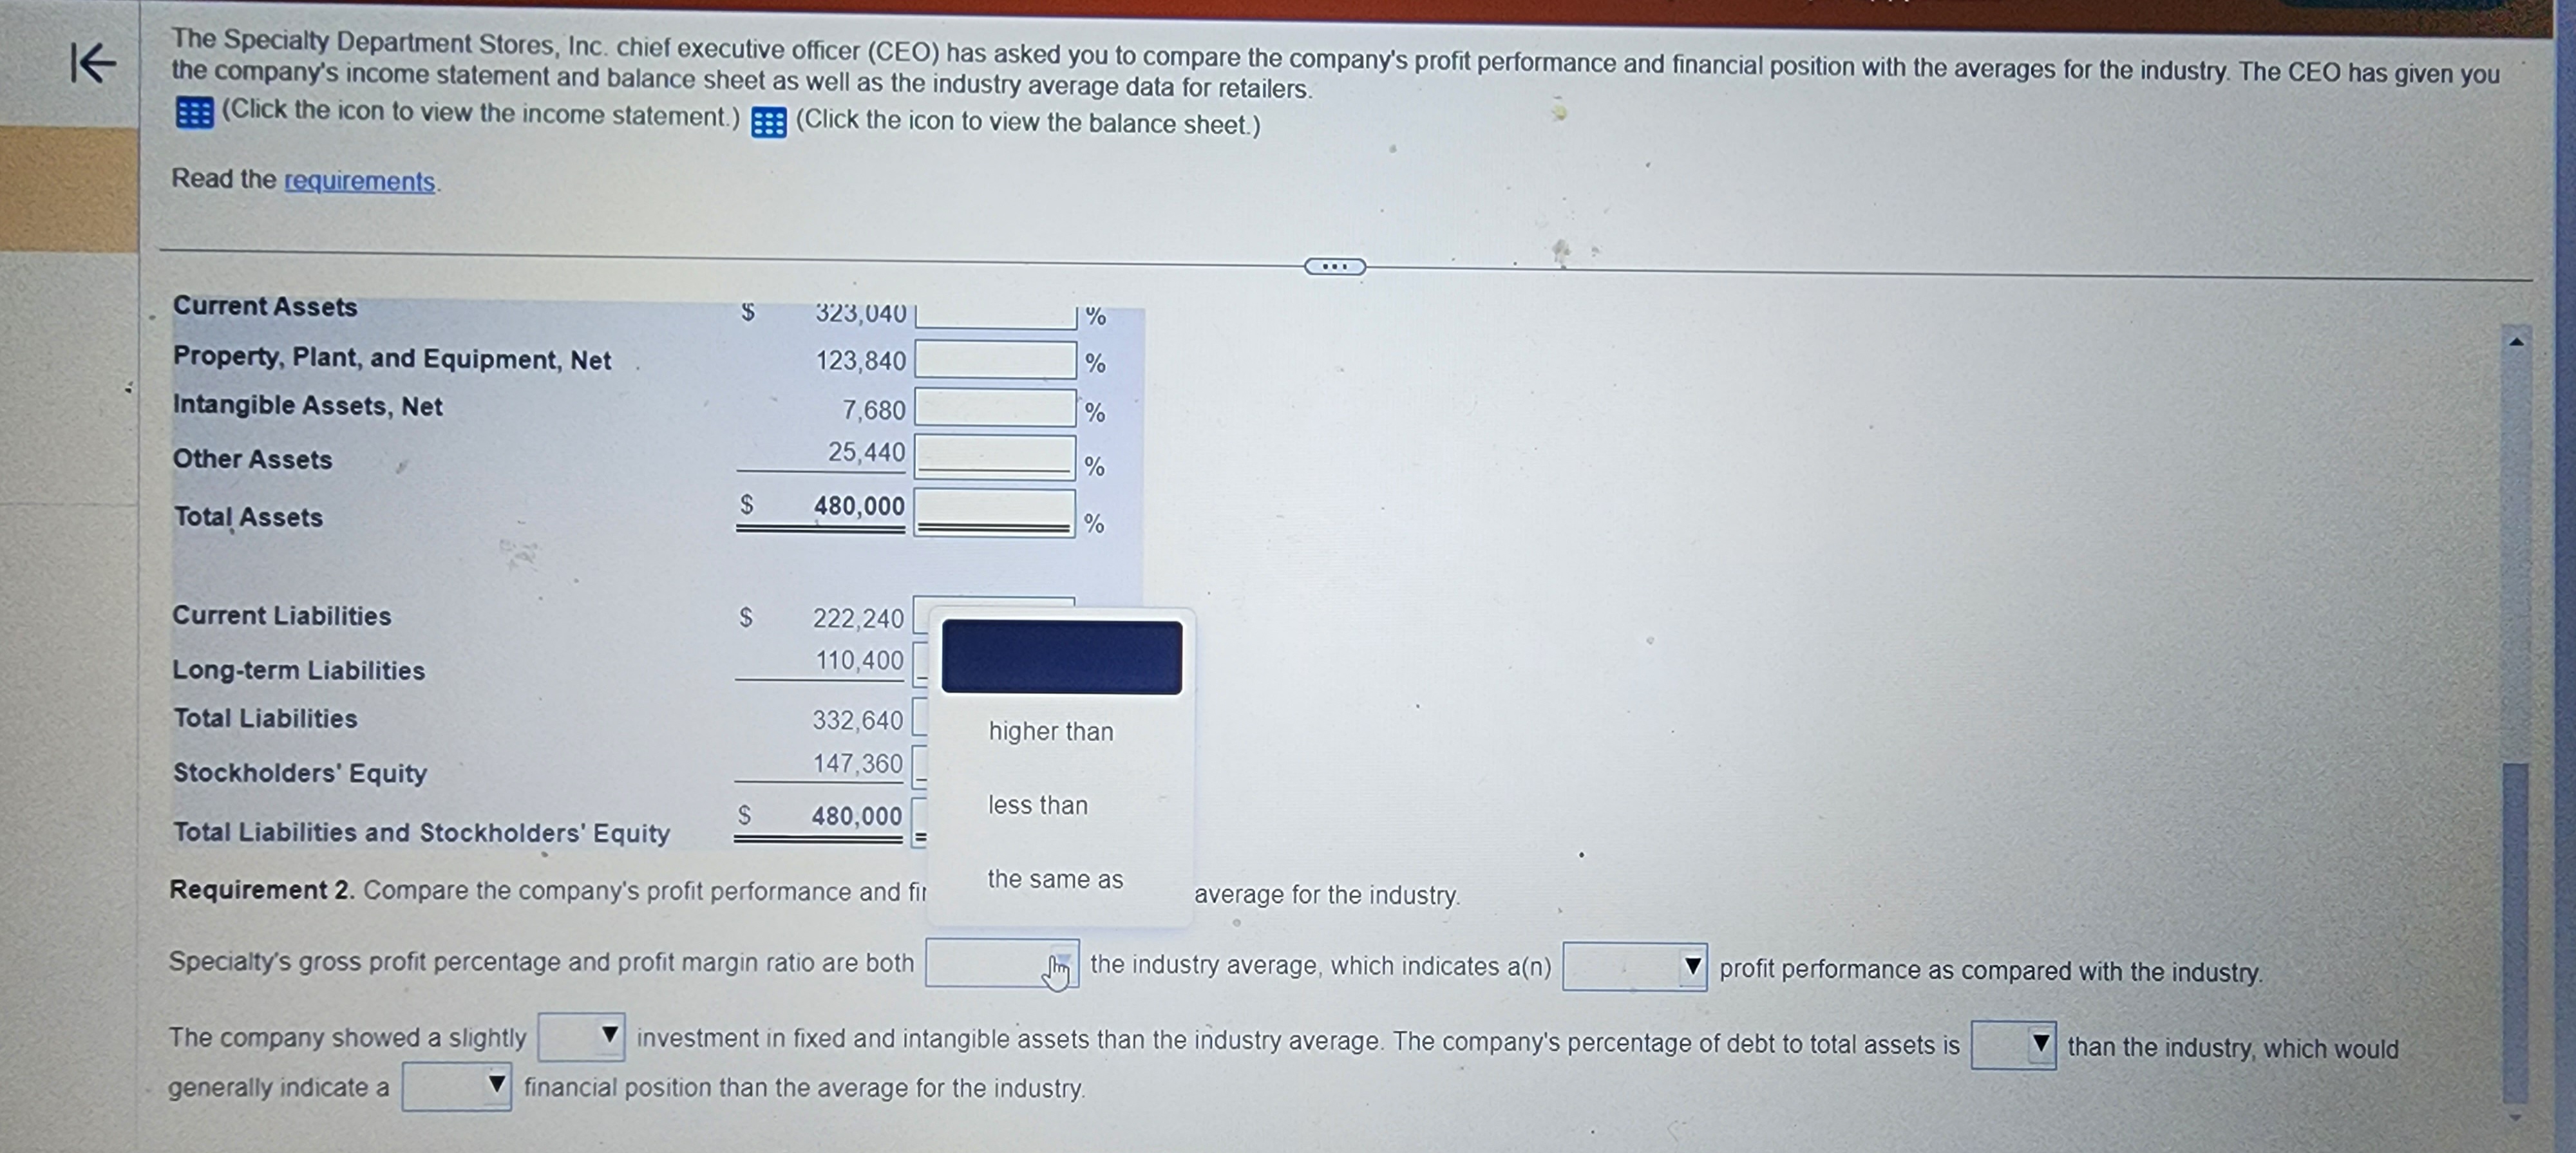
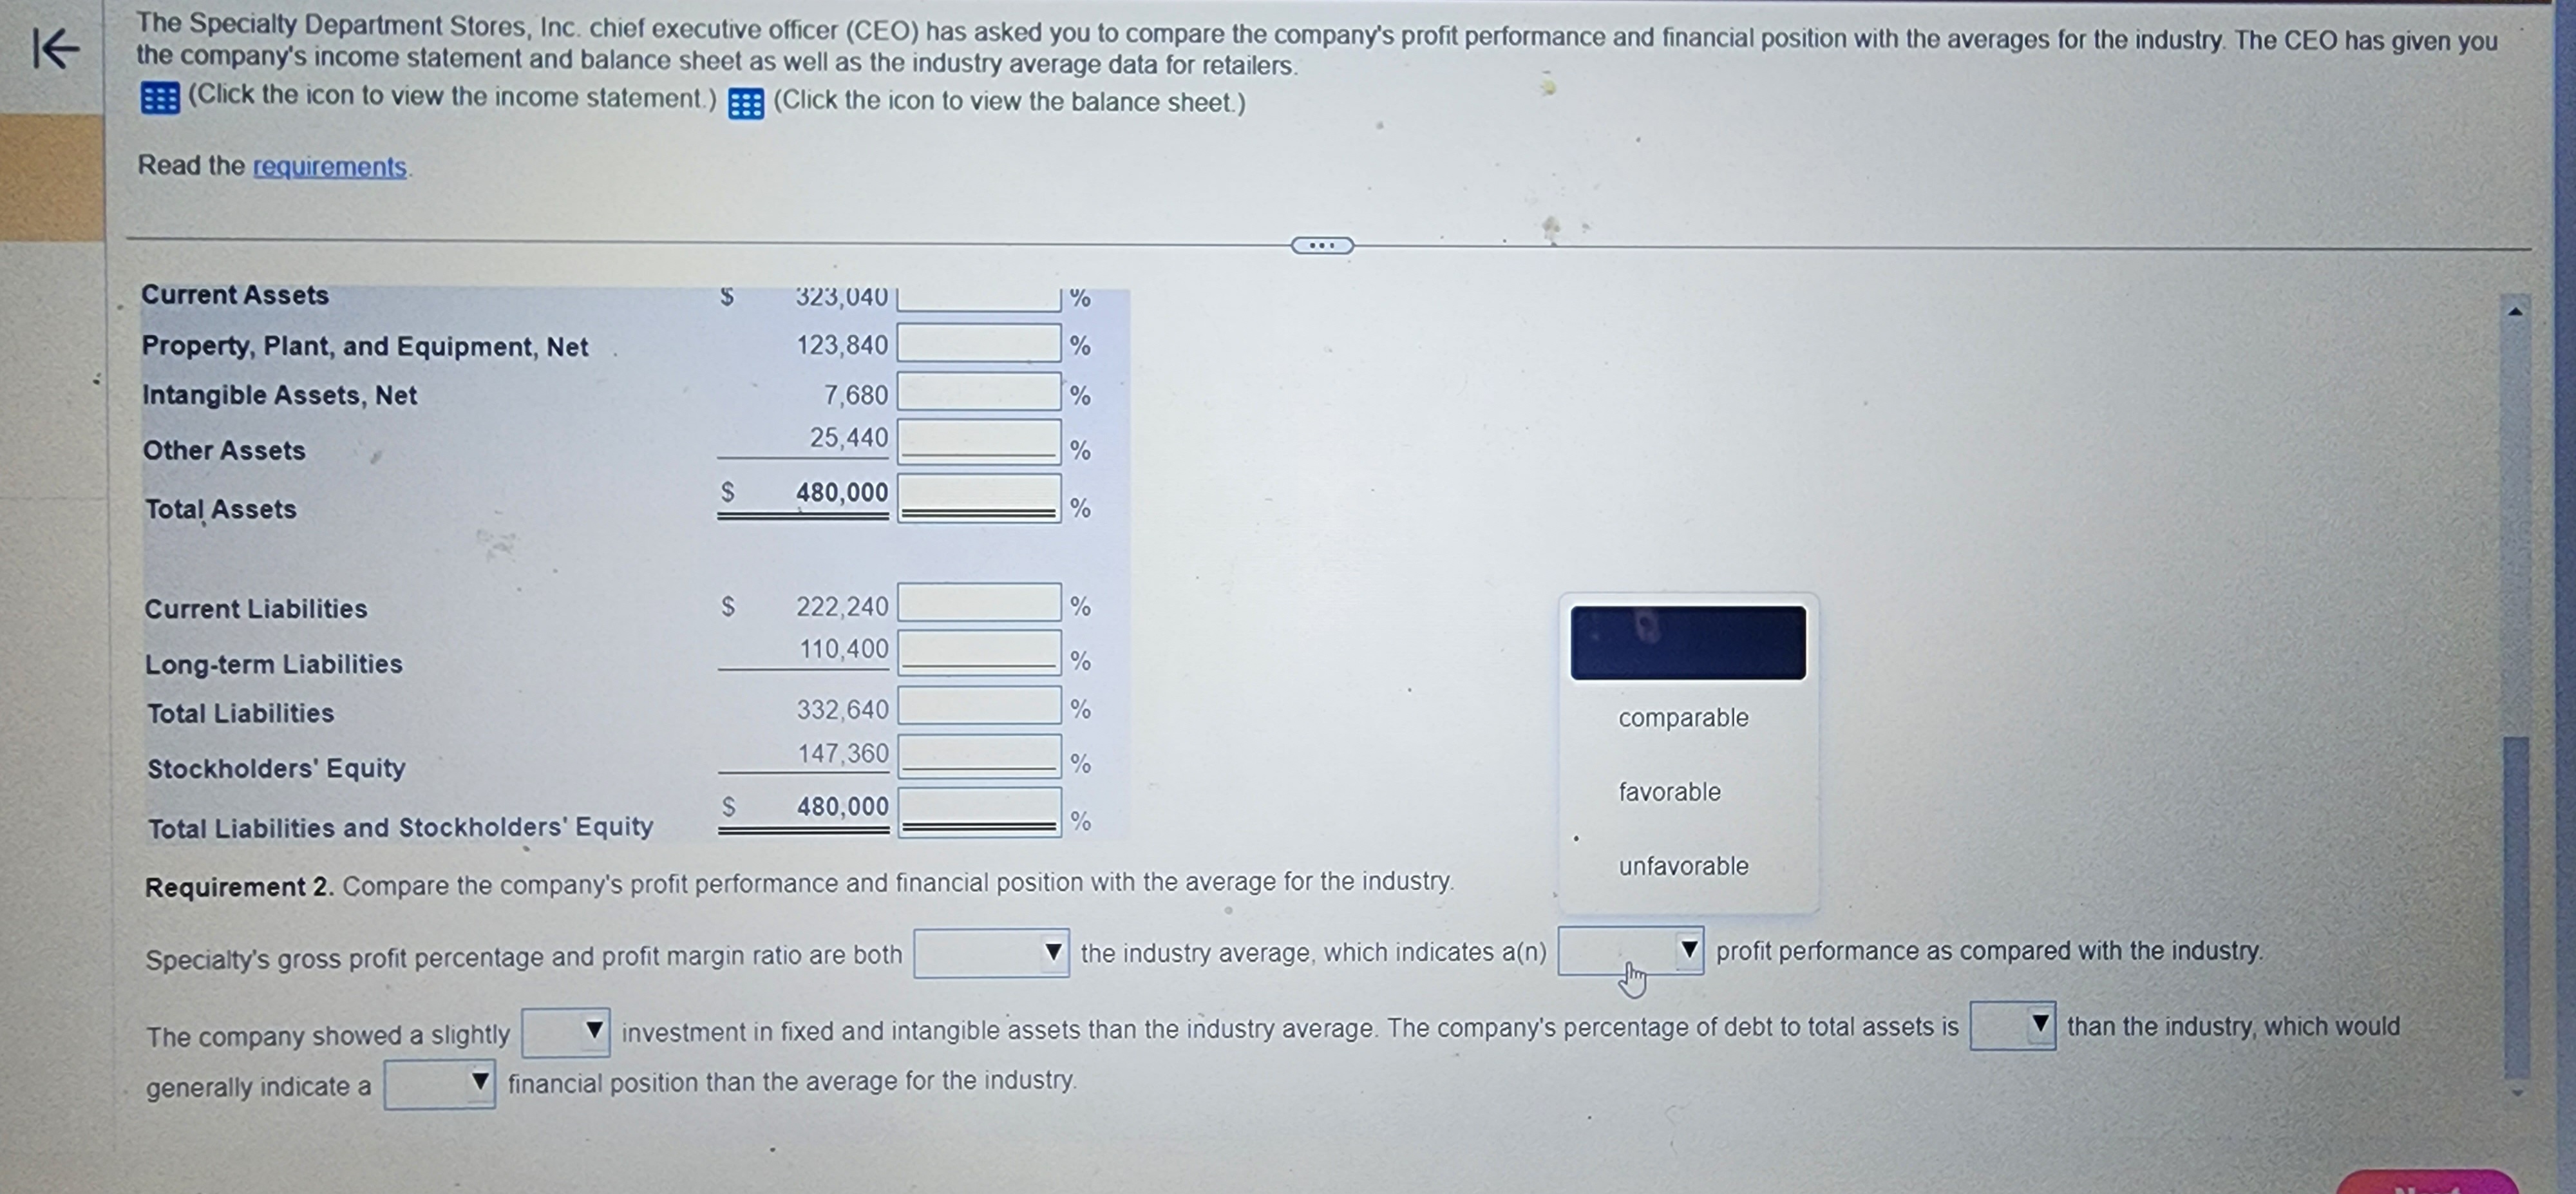
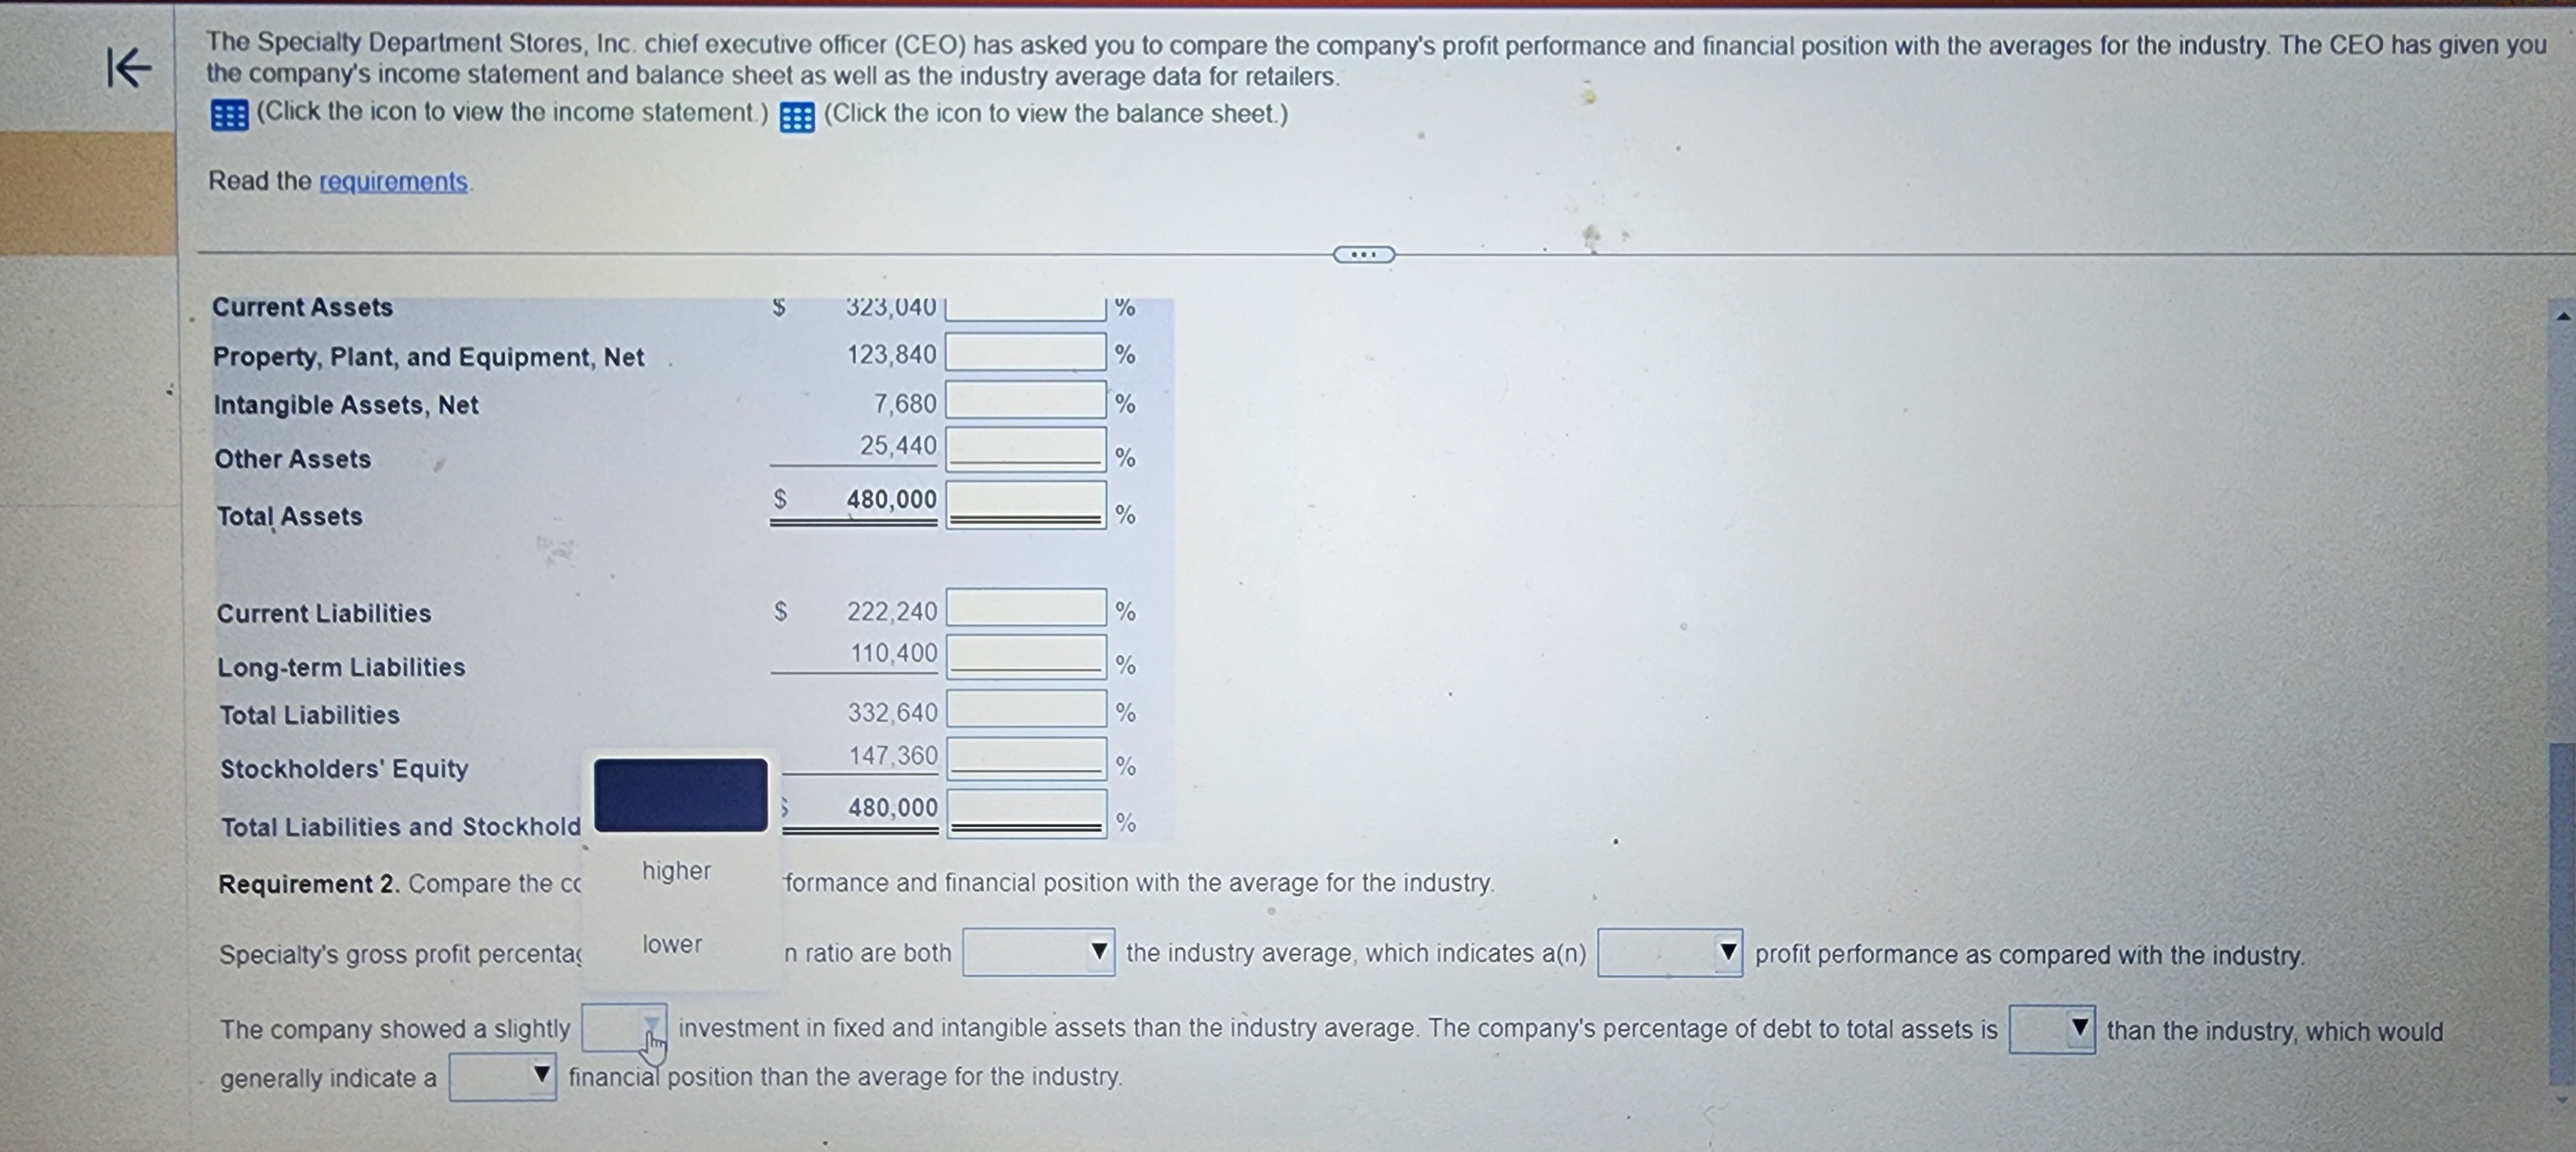
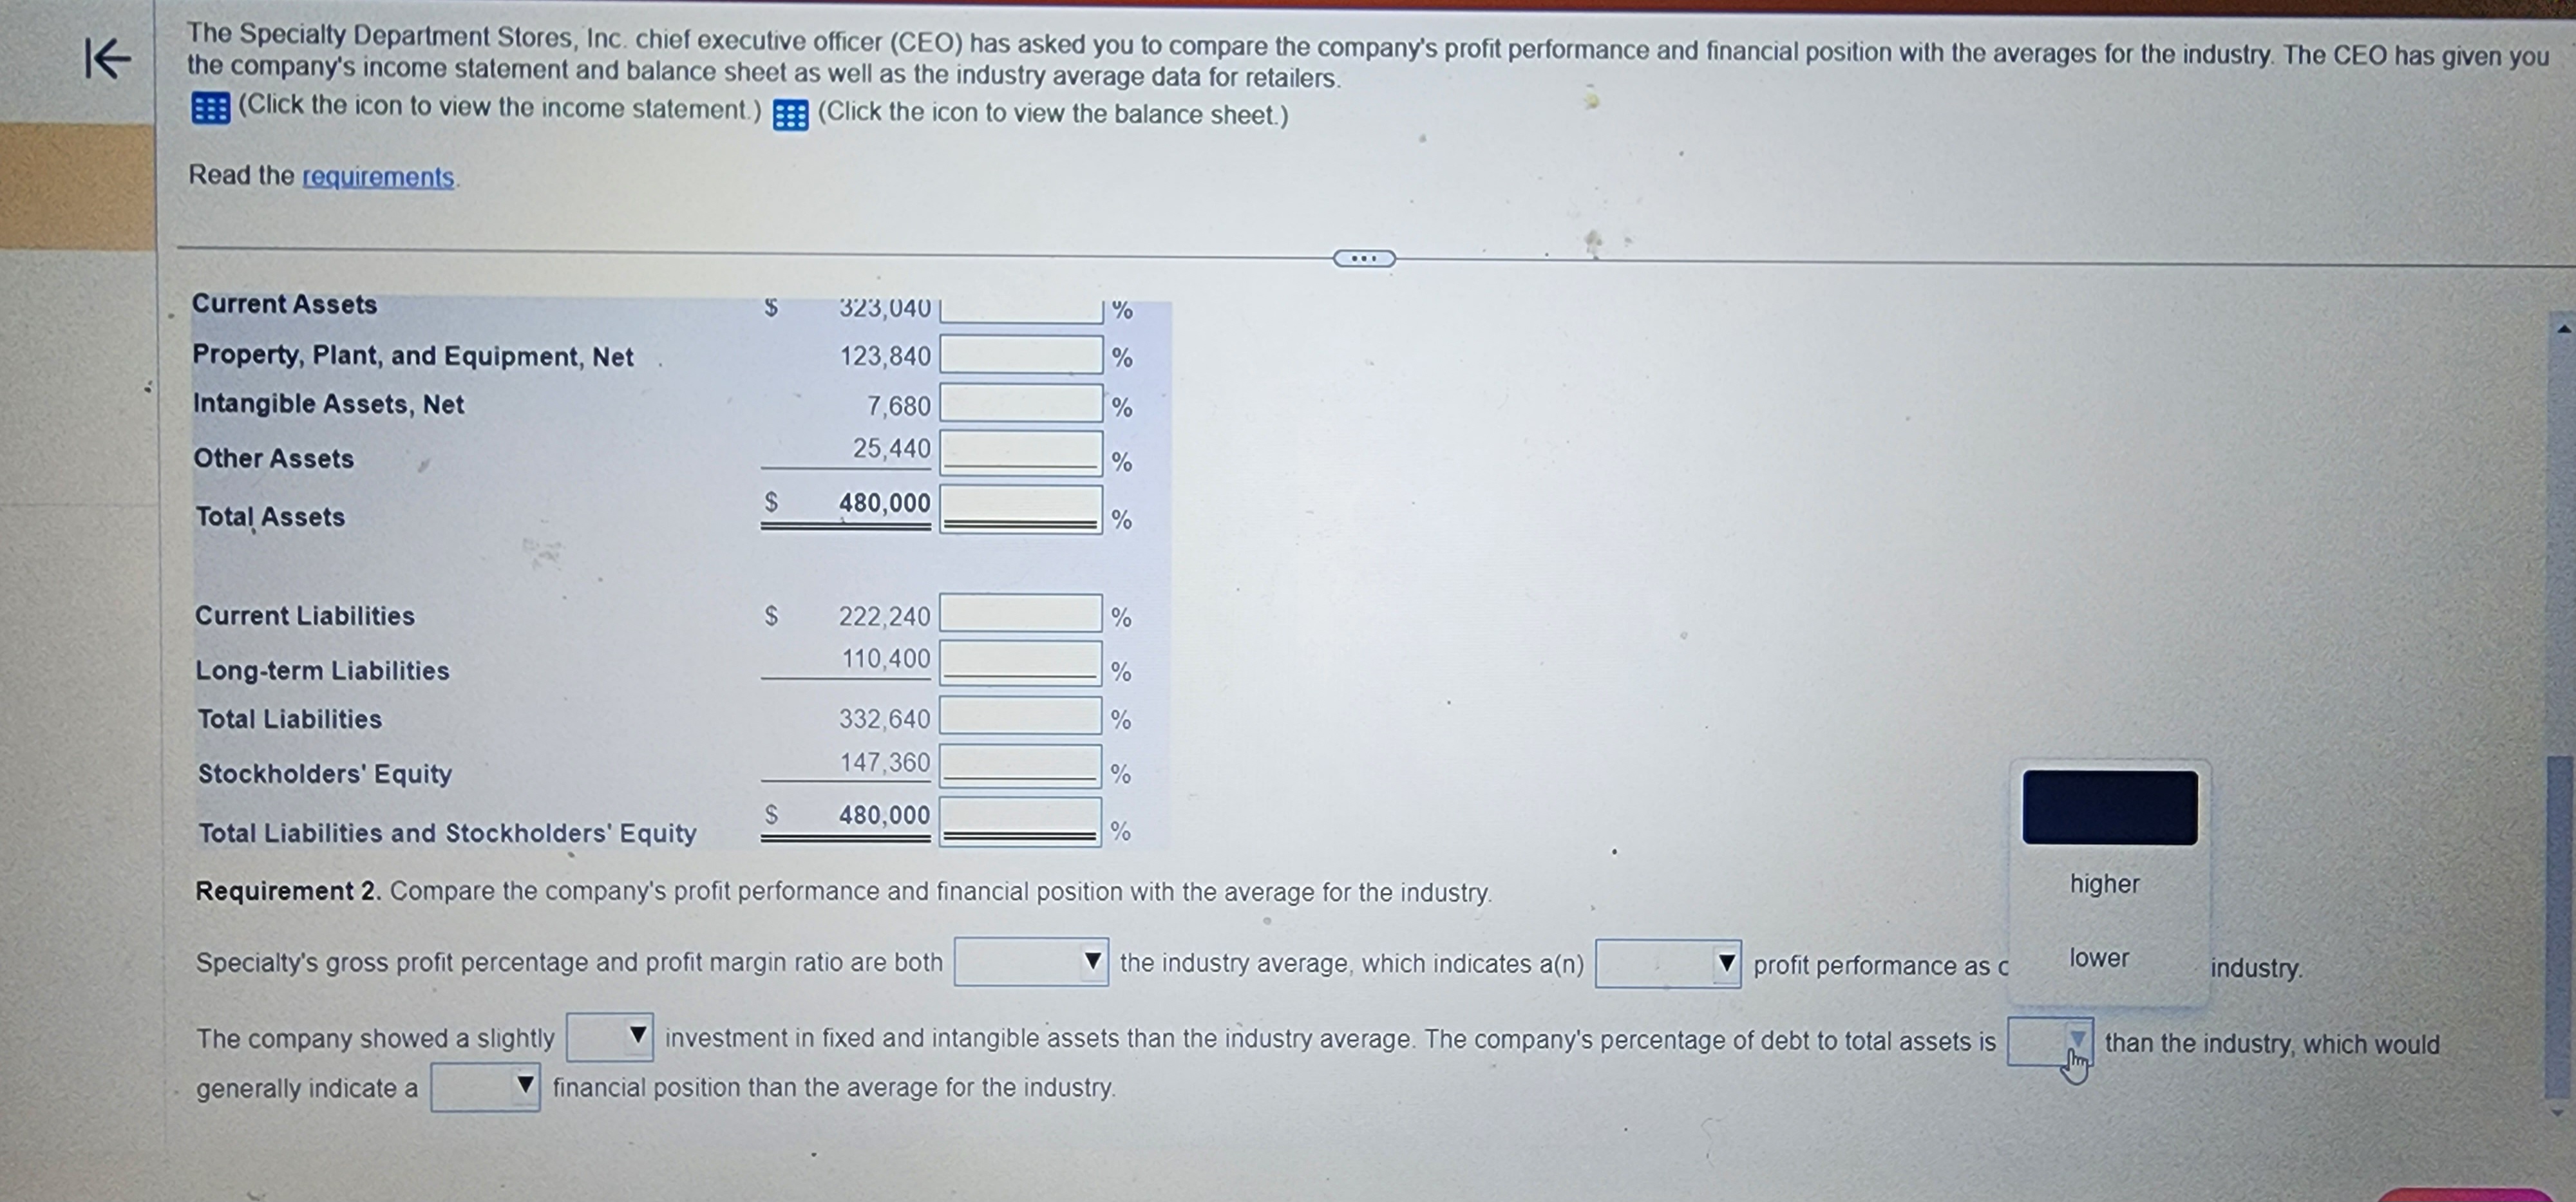
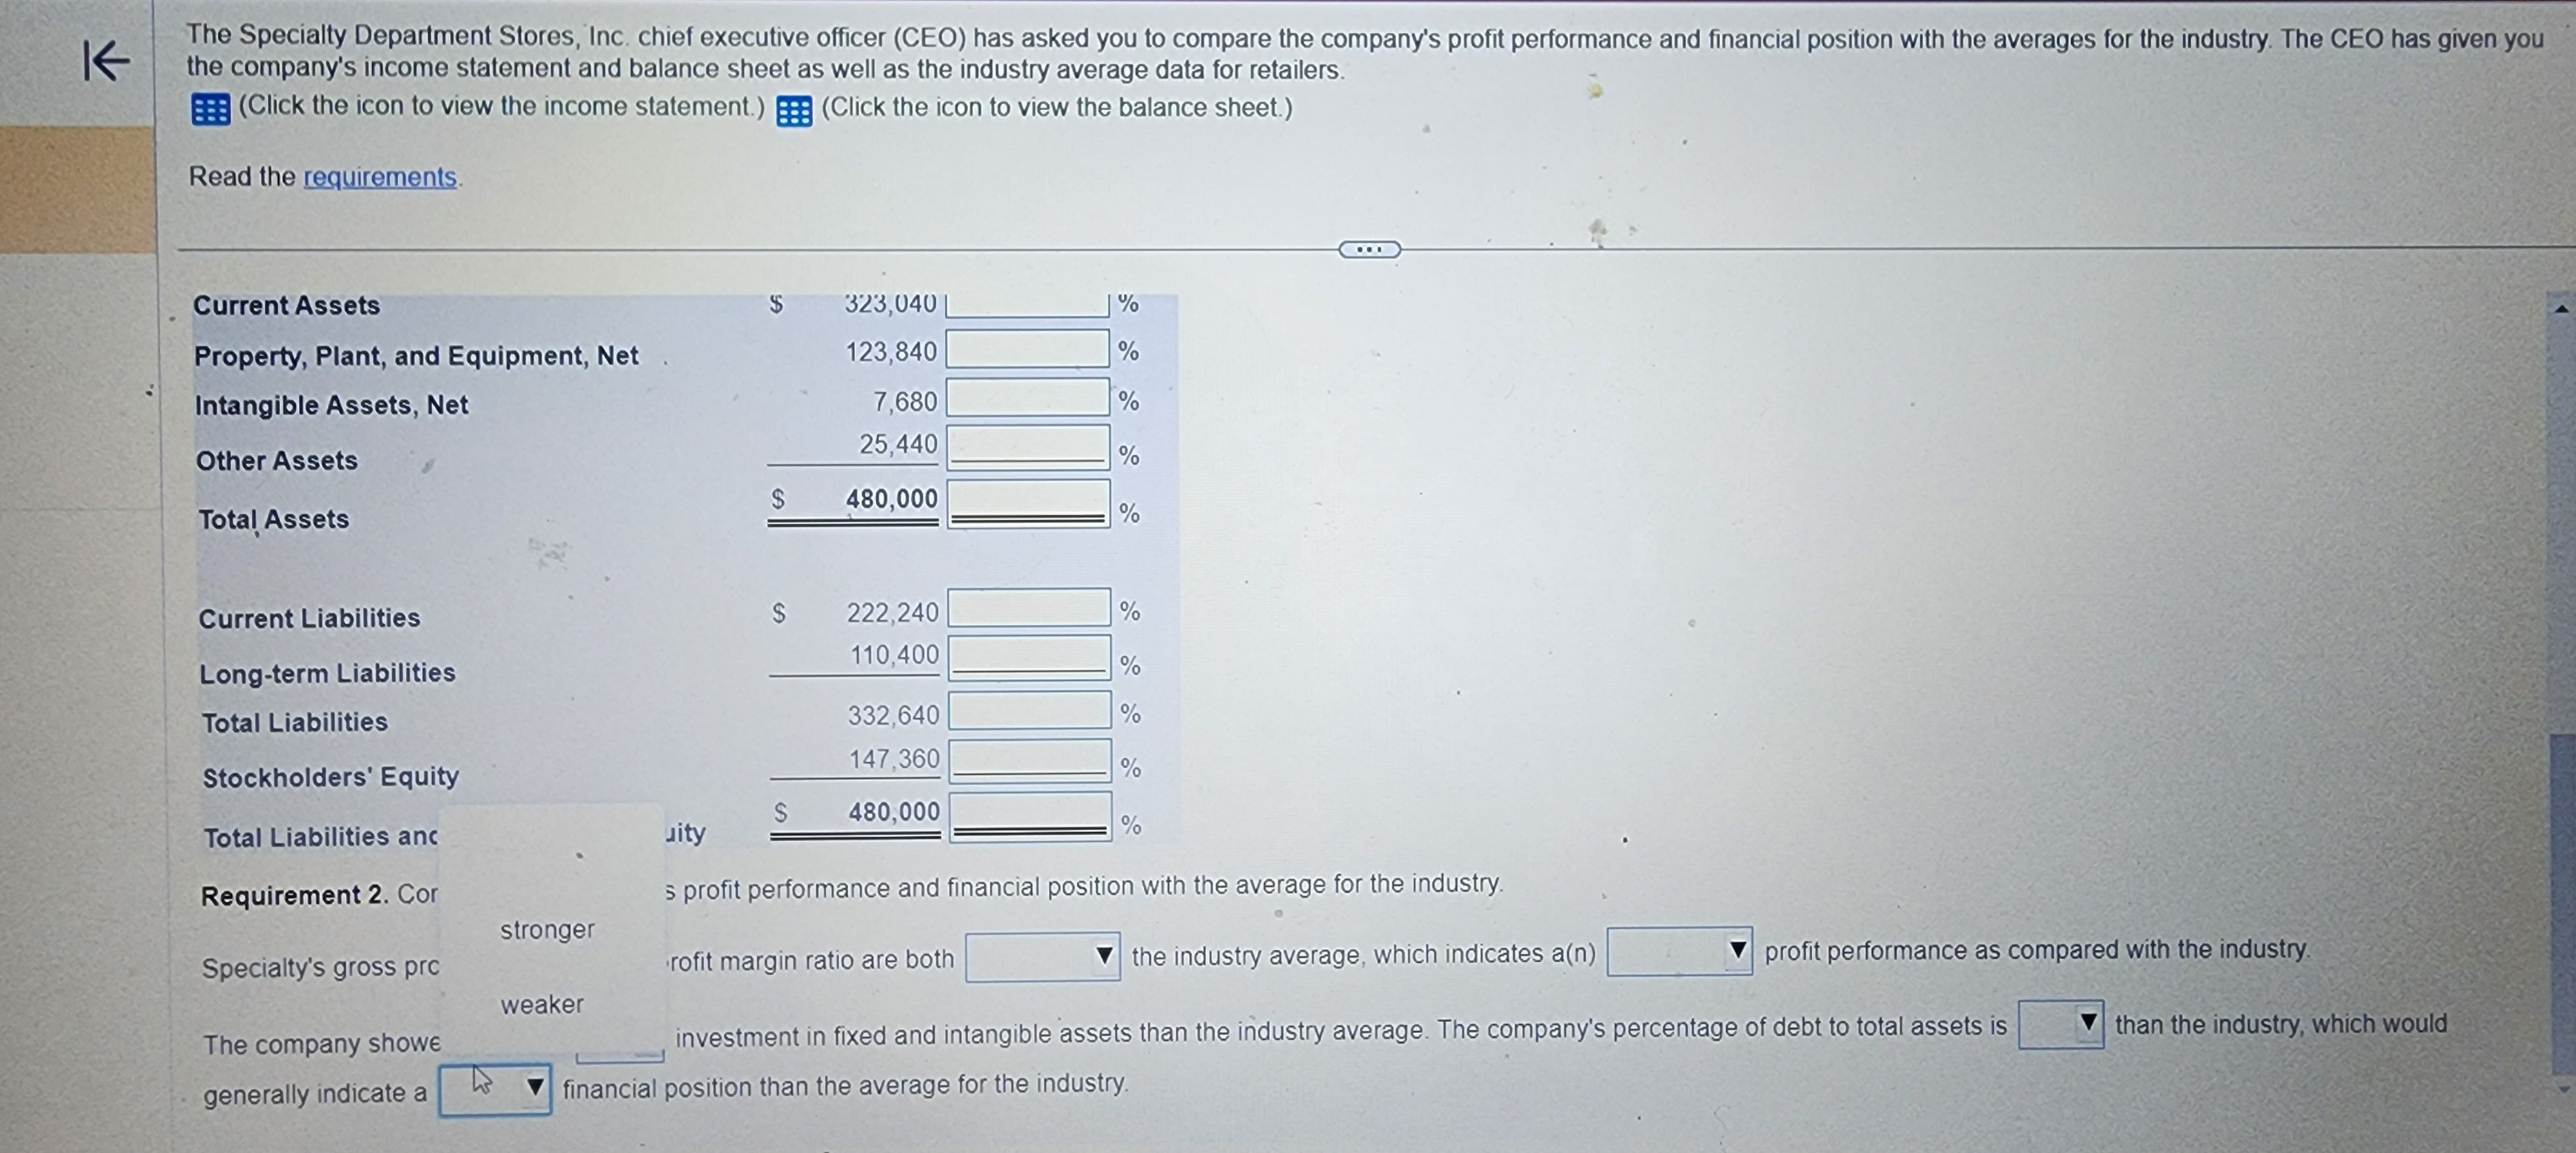
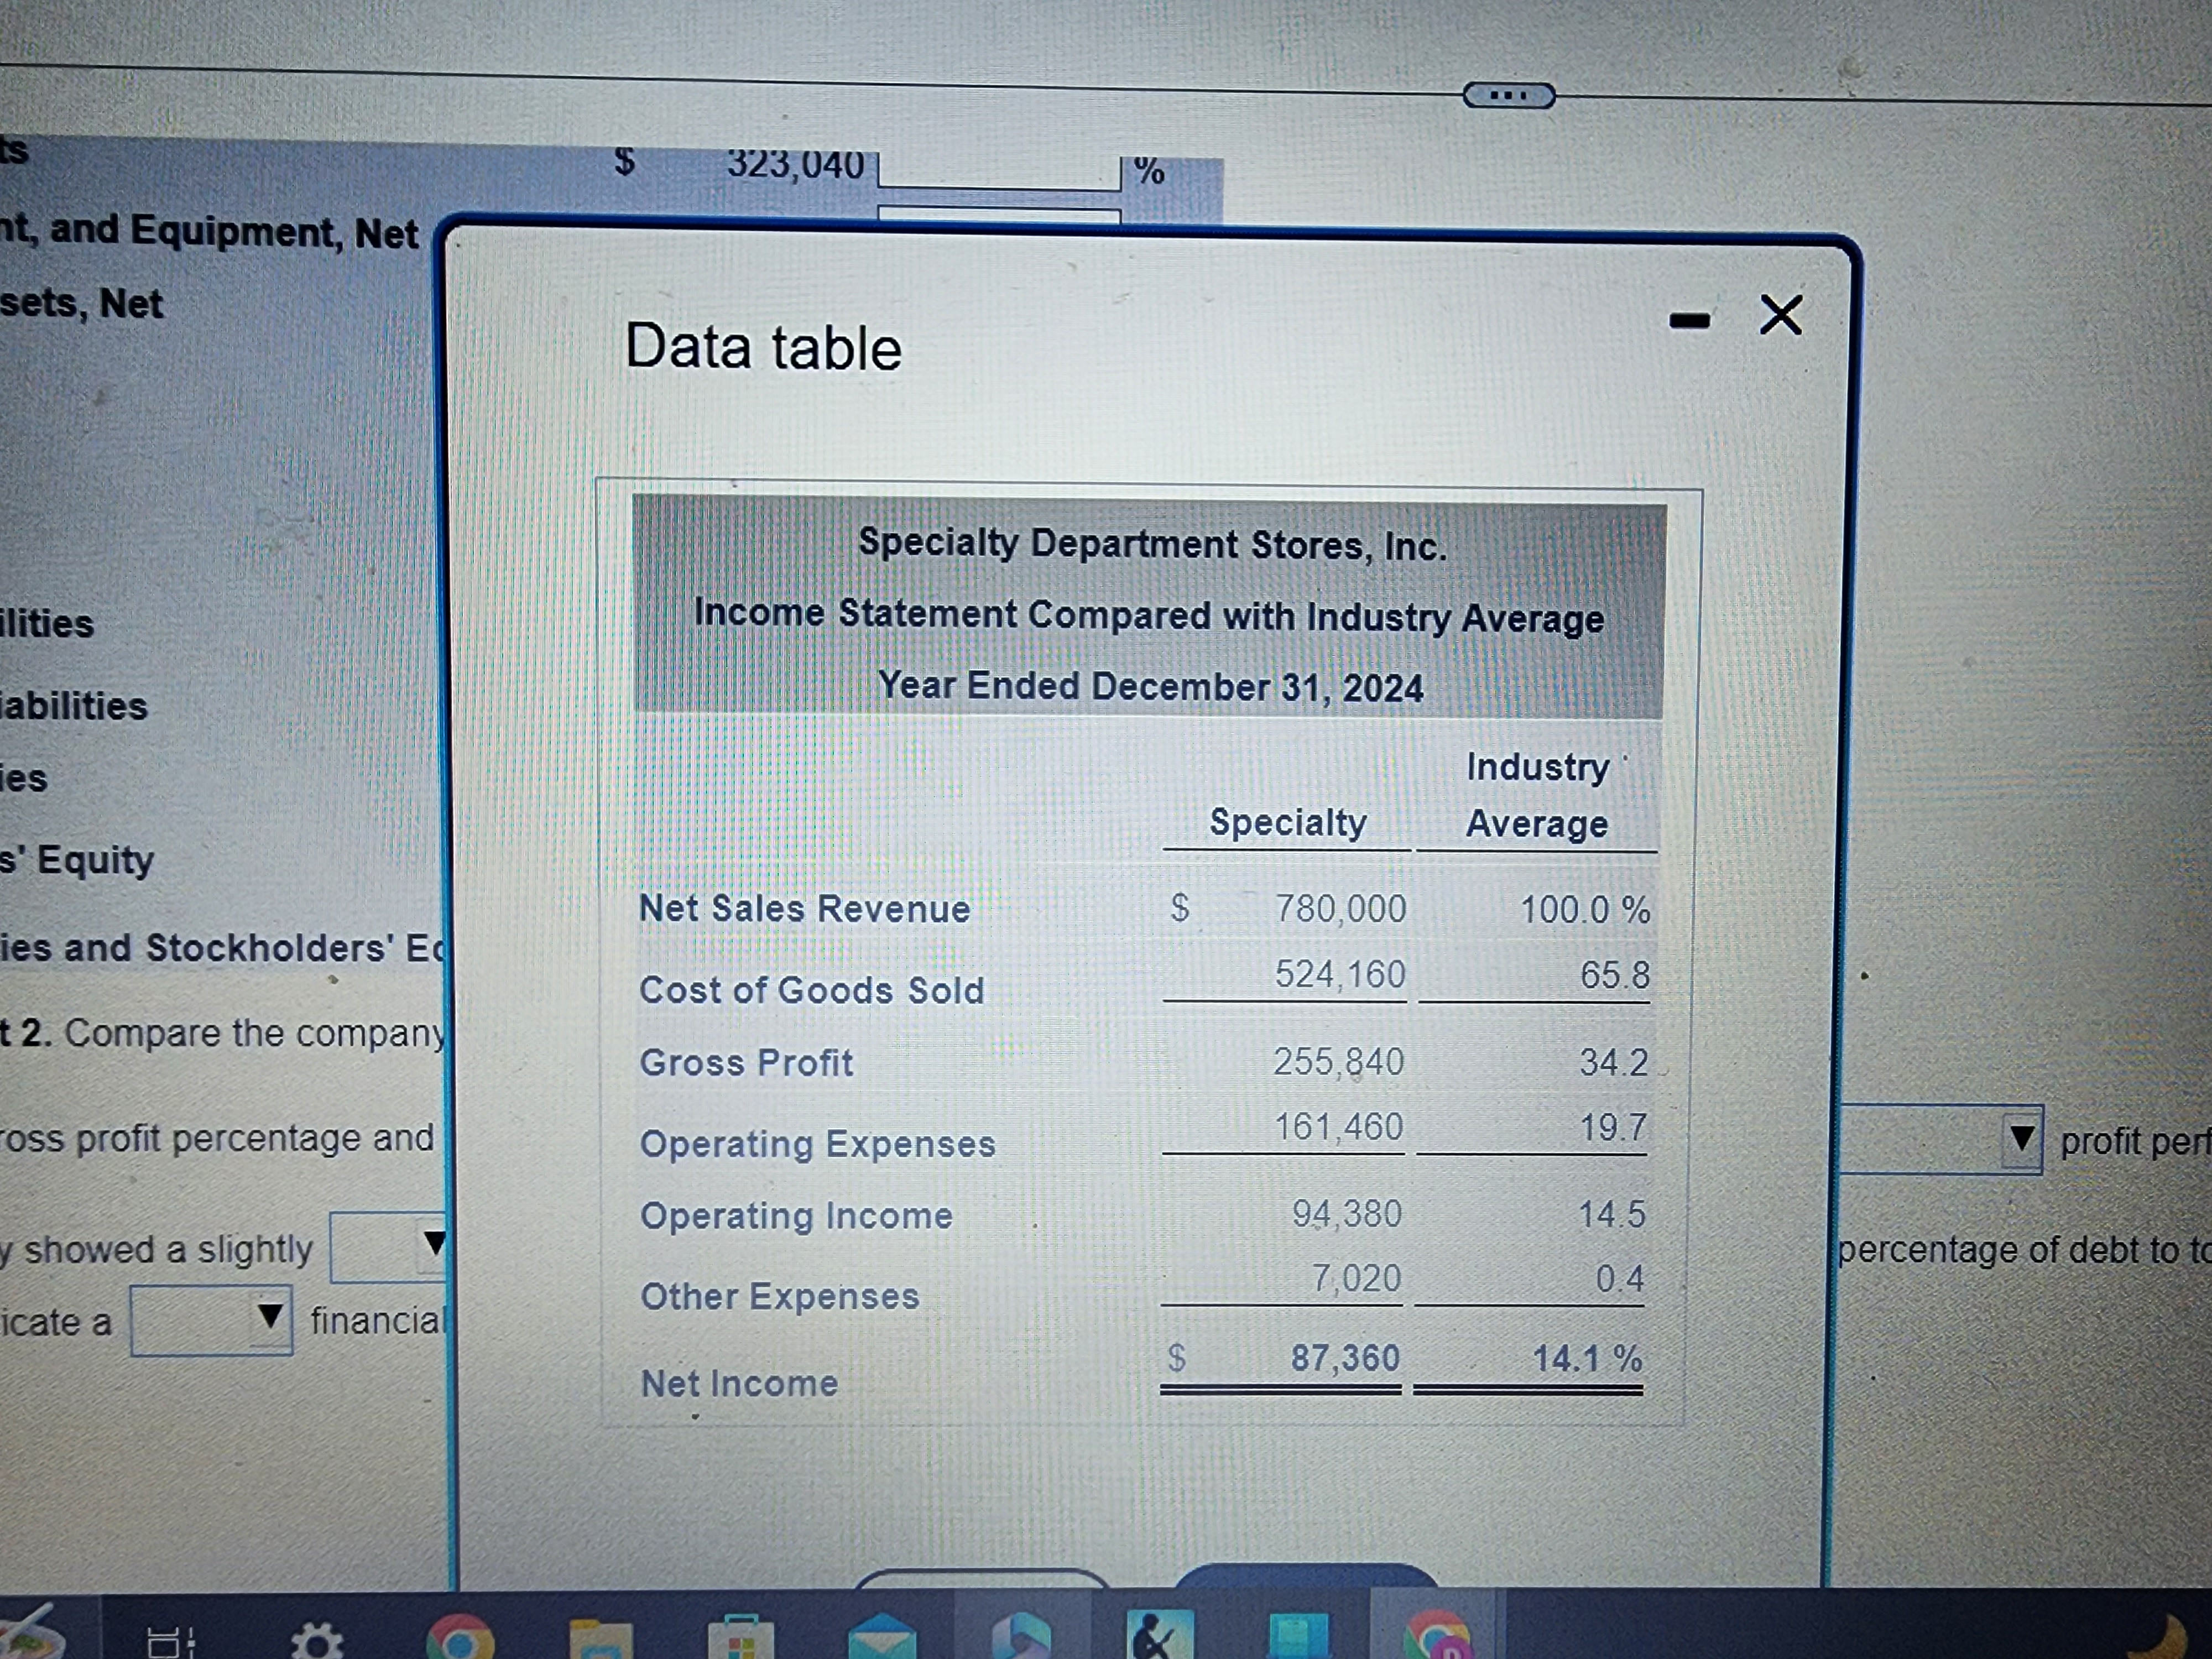
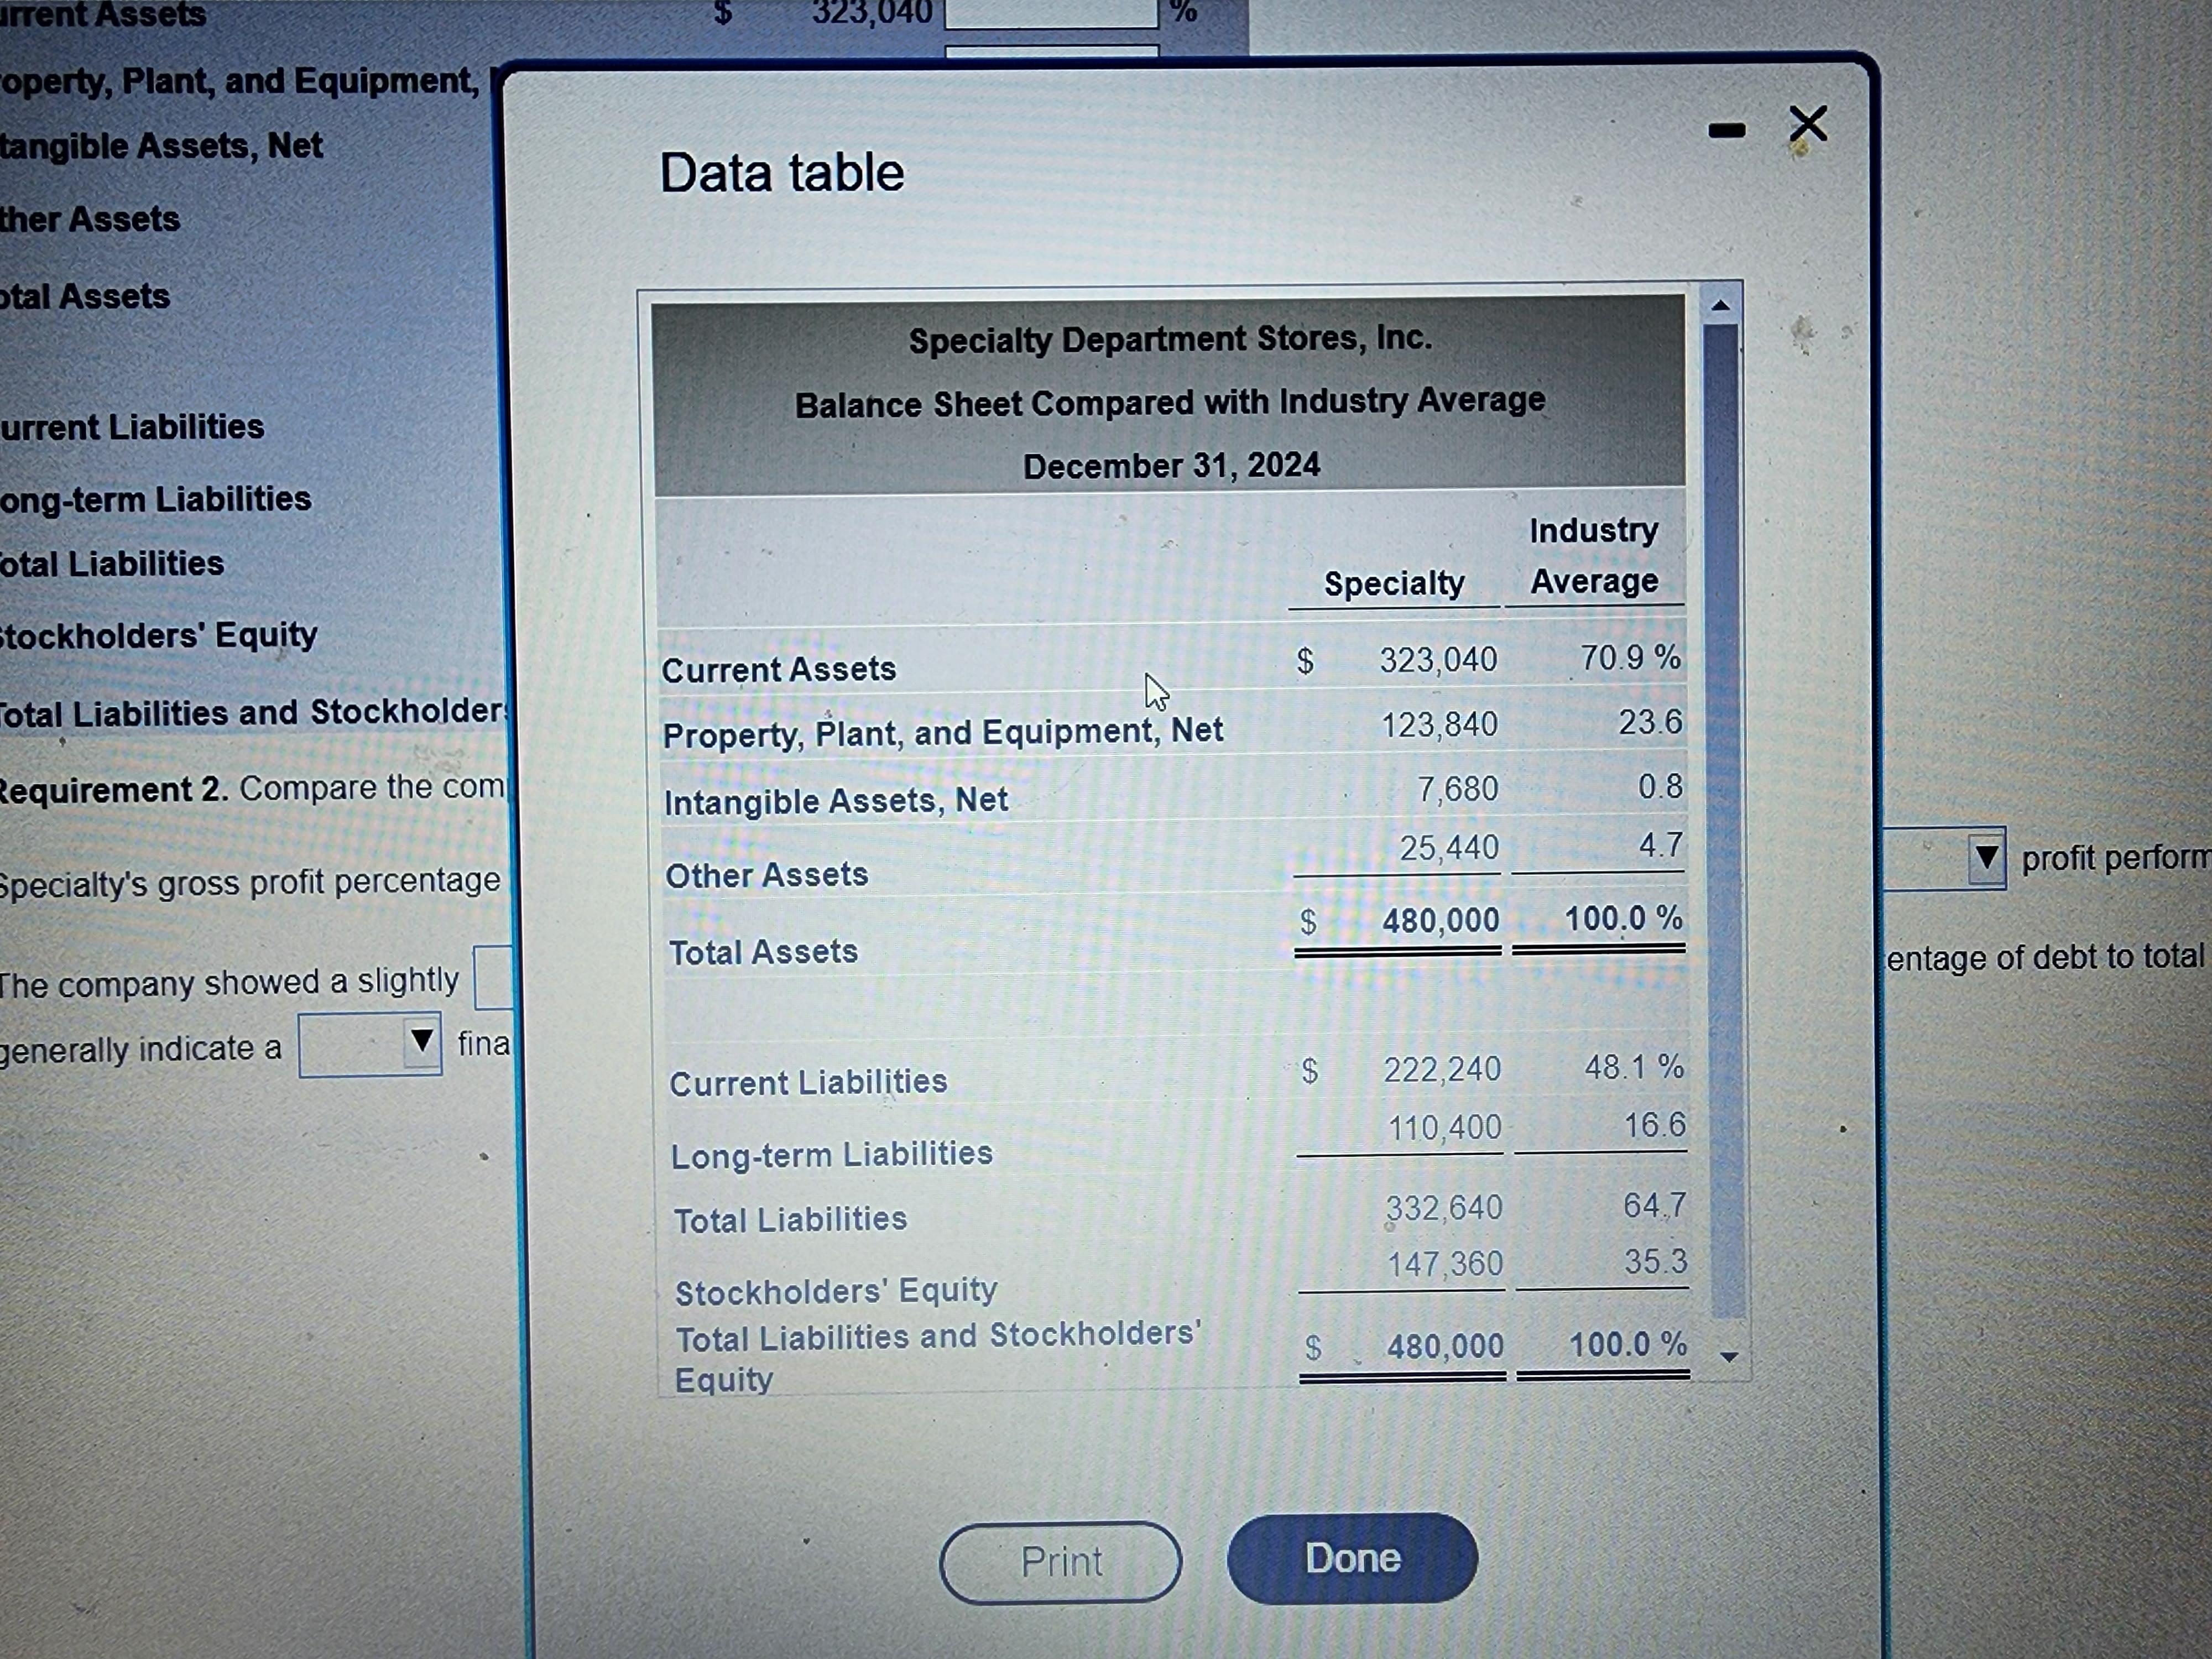
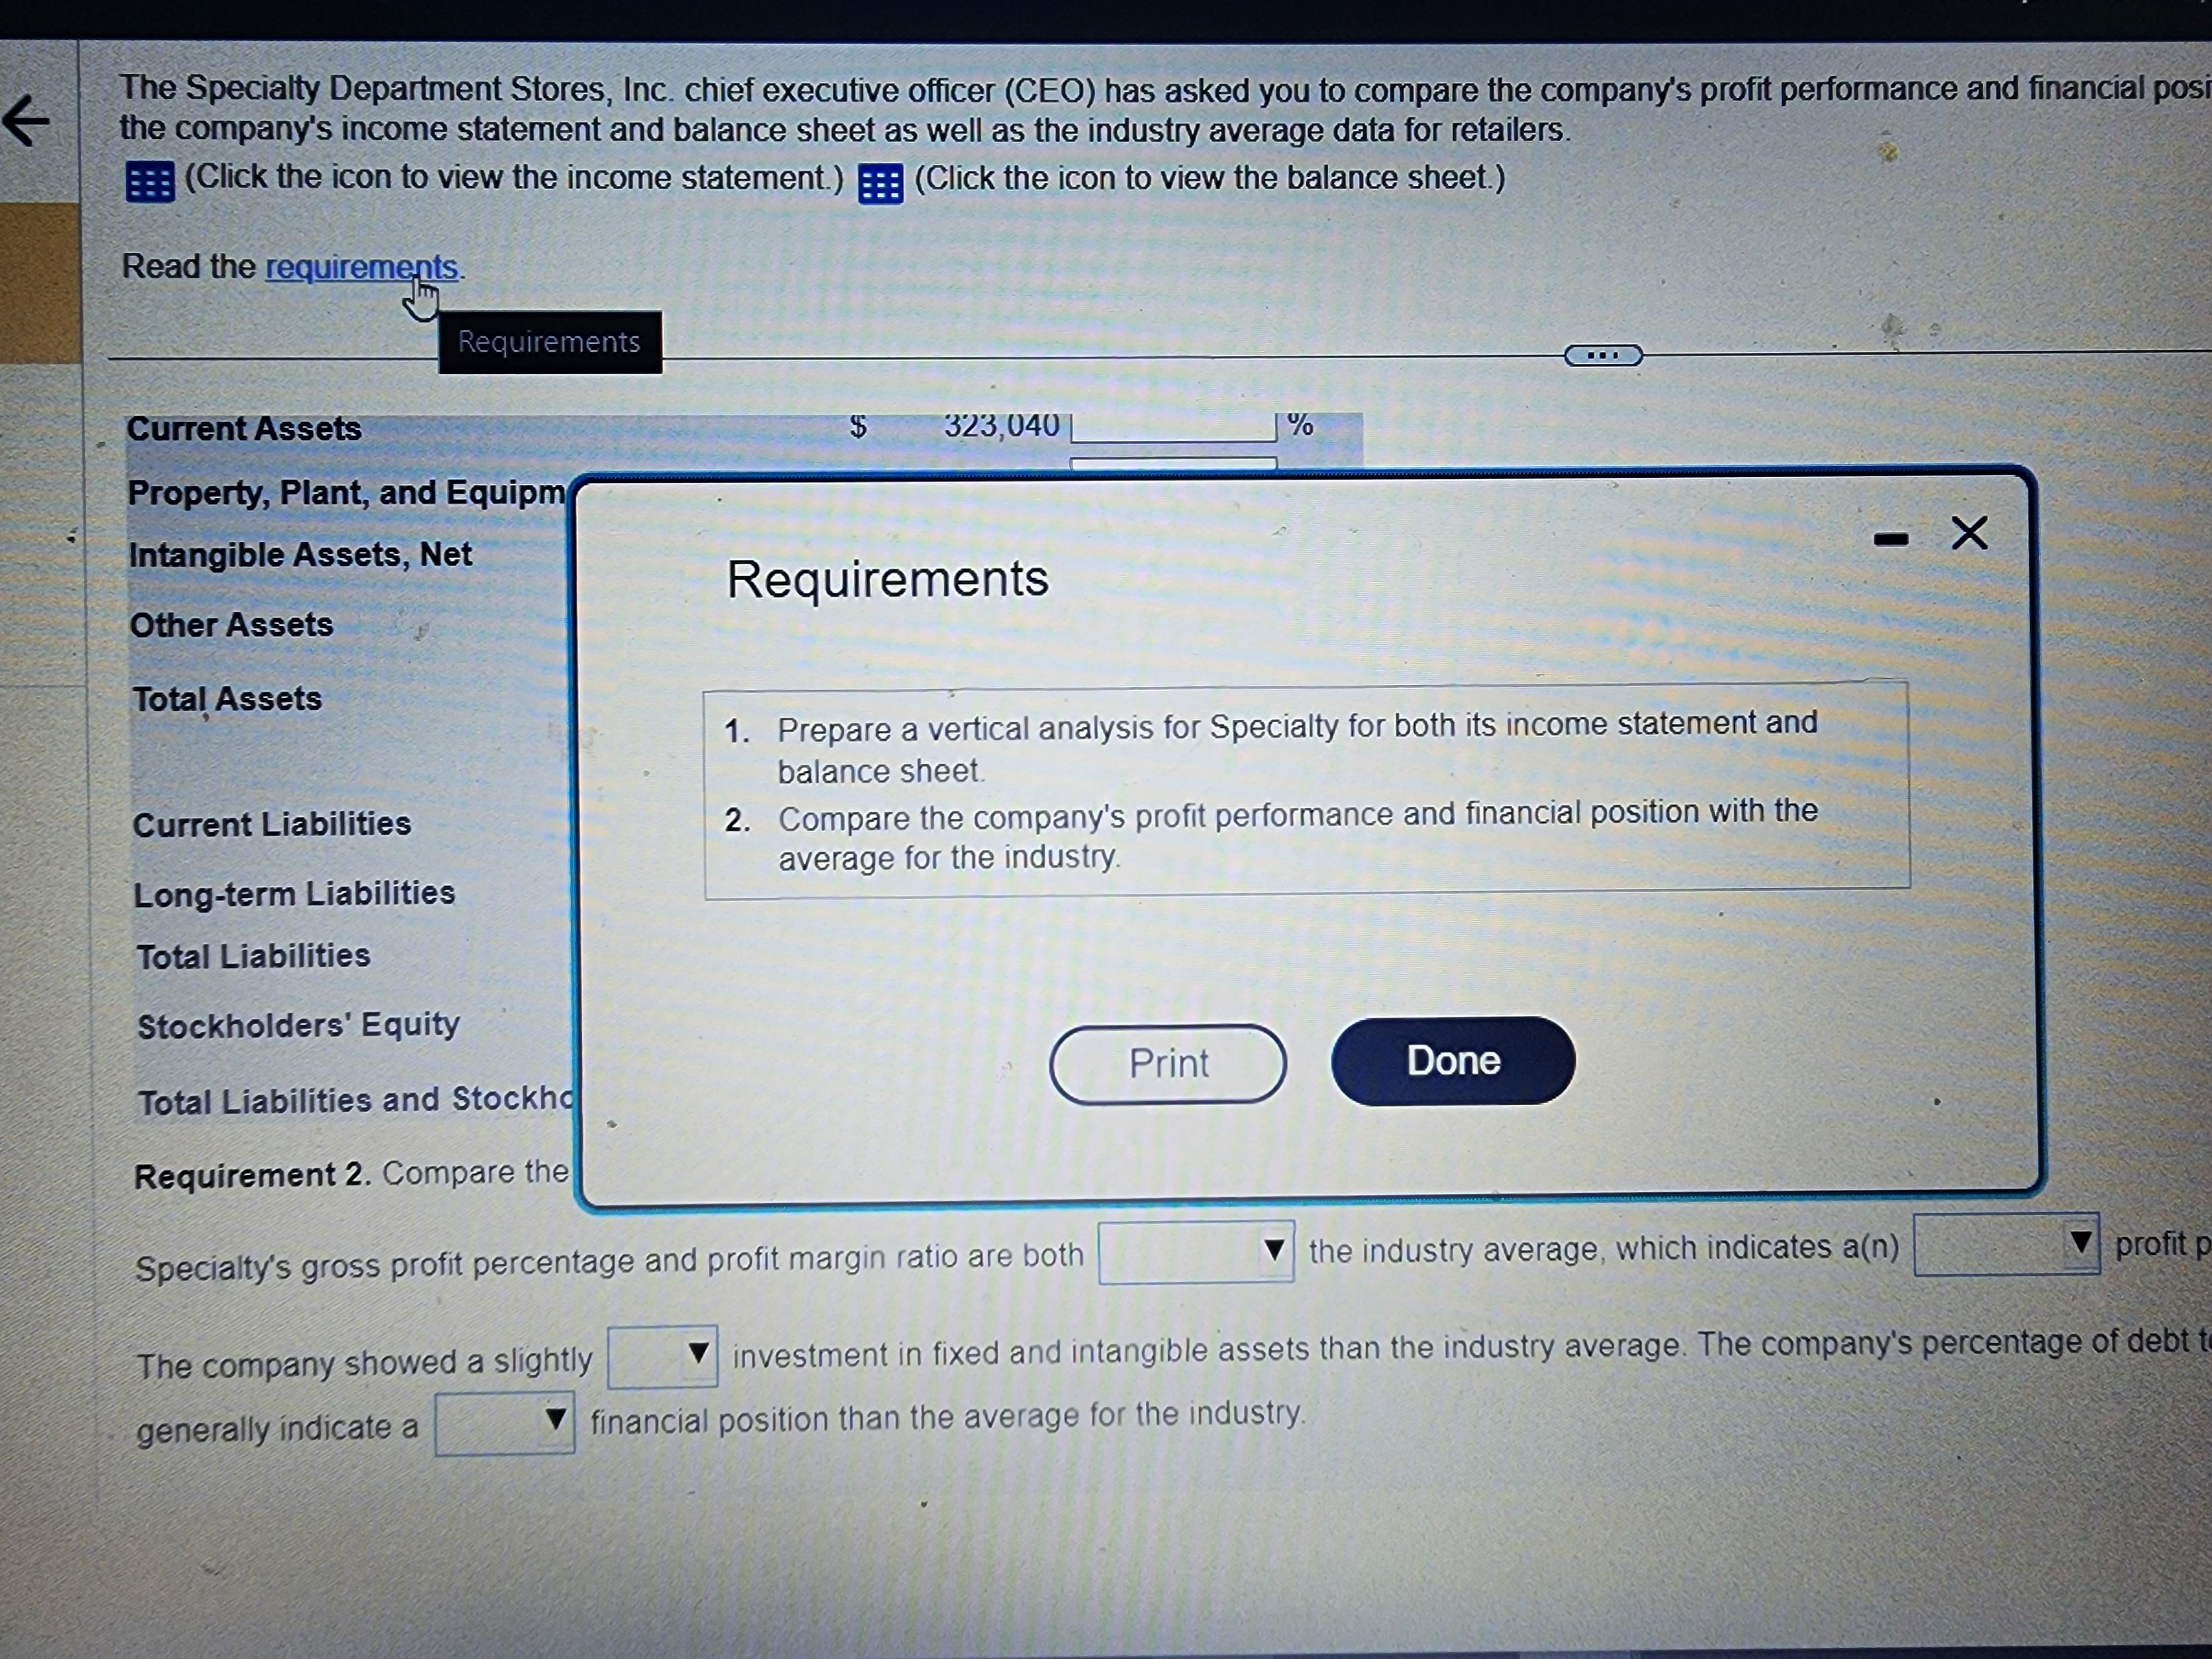
The Specialty Department Stores, Inc. chief executive officer (CEO) has asked you to compare the company's profit performance and financial position with the averages for the industry. The CEO has given you the company's income statement and balance sheet as well as the industry average data for retailers Requirement 1. Prepare a vertical analysis for Specialty for both its income statement and balance sheet. Begin by preparing a vertical analysis for Specialty for its income statement. (Round the percent of total amounts to one decimal place, XX, and do not enter the %. For example, enter 10.1% as 10.1) Specialty Department Stores, Inc. Income Statement Year Ended December 31, 2024 Amount Percent of Total Net Sales Revenue $ 780,000 524,160 Cost of Goods Sold % Gross Profit 255,840 161,460 Operating Expenses Operating Income 94,380 Other Expenses Net Income 7,020 87,360 Prepare a vertical analysis for Specialty for its balance sheet (Round the percent of total amounts to one decimal place, XX, and do not enter the %. For example, enter 10 1% as 10.1.) K The Specialty Department Stores, Inc. chief executive officer (CEO) has asked you to compare the company's profit performance and financial position with the averages for the industry. The CEO has given you the company's income statement and balance sheet as well as the industry average data for retailers. (Click the icon to view the balance sheet.) (Click the icon to view the income statement.) Read the requirements. Prepare a vertical analysis for Specialty for its balance sheet. (Round the percent of total amounts to one decimal place, X.X, and do not enter the %. For example, enter 10.1% as 10.1.) Specialty Department Stores, Inc. Balance Sheet December 31, 2024 Amount Percent of Total Current Assets $ 323,040 % Property, Plant, and Equipment, Net 123,840 % Intangible Assets, Net 7,680 % 25,440 % Other Assets $ 480,000 % Total Assets Current Liabilities Long-term Liabilities $ 222,240 % 110,400 % 332,640 % Total Liabilities 147,360 I % Stockholders' Equity $ 480,000 % Total Liabilities and Stockholders' Equity K The Specialty Department Stores, Inc. chief executive officer (CEO) has asked you to compare the company's profit performance and financial position with the averages for the industry. The CEO has given you the company's income statement and balance sheet as well as the industry average data for retailers. (Click the icon to view the balance sheet.) BEE (Click the icon to view the income statement.) Read the requirements. Current Assets $ 323,040 Property, Plant, and Equipment, Net 123,840 7,680 Do do do % % % Intangible Assets, Net 25,440 % Other Assets $ 480,000 % Total Assets Current Liabilities $ 222,240 % 110,400 Long-term Liabilities % Total Liabilities 332,640 % 147,360 Stockholders' Equity % $ 480,000 Total Liabilities and Stockholders' Equity % Requirement 2. Compare the company's profit performance and financial position with the average for the industry. Specialty's gross profit percentage and profit margin ratio are both the industry average, which indicates a(n) profit performance as compared with the industry. The company showed a slightly generally indicate a investment in fixed and intangible assets than the industry average. The company's percentage of debt to total assets is financial position than the average for the industry. than the industry, which would The Specialty Department Stores, Inc. chief executive officer (CEO) has asked you to compare the company's profit performance and financial position with the averages for the industry. The CEO has given you the company's income statement and balance sheet as well as the industry average data for retailers. (Click the icon to view the balance sheet.) (Click the icon to view the income statement.) Read the requirements. Current Assets $ 323,040 % Property, Plant, and Equipment, Net 123,840 % Intangible Assets, Net 7,680 % 25,440 Other Assets % $ 480,000 Total Assets % Current Liabilities Long-term Liabilities $ 222,240 110,400 Total Liabilities 332,640 higher than Stockholders' Equity $ 147,360 480,000 less than Total Liabilities and Stockholders' Equity the same as Requirement 2. Compare the company's profit performance and fir average for the industry. the industry average, which indicates a(n) Specialty's gross profit percentage and profit margin ratio are both The company showed a slightly generally indicate a profit performance as compared with the industry. than the industry, which would investment in fixed and intangible assets than the industry average. The company's percentage of debt to total assets is financial position than the average for the industry. K The Specialty Department Stores, Inc. chief executive officer (CEO) has asked you to compare the company's profit performance and financial position with the averages for the industry. The CEO has given you the company's income statement and balance sheet as well as the industry average data for retailers. (Click the icon to view the balance sheet.) BEE (Click the icon to view the income statement.) Read the requirements. Current Assets Property, Plant, and Equipment, Net Intangible Assets, Net Other Assets Total Assets $ 323,040 % 123,840 % 7,680 % 25,440 % $ 480,000 % Current Liabilities $ 222,240 % 110,400 Long-term Liabilities % Total Liabilities 332,640 % 147,360 % Stockholders' Equity $ 480,000 % Total Liabilities and Stockholders' Equity comparable favorable Requirement 2. Compare the company's profit performance and financial position with the average for the industry. Specialty's gross profit percentage and profit margin ratio are both unfavorable the industry average, which indicates a(n) profit performance as compared with the industry. The company showed a slightly generally indicate a investment in fixed and intangible assets than the industry average. The company's percentage of debt to total assets is financial position than the average for the industry. than the industry, which would K The Specialty Department Stores, Inc. chief executive officer (CEO) has asked you to compare the company's profit performance and financial position with the averages for the industry. The CEO has given you the company's income statement and balance sheet as well as the industry average data for retailers. (Click the icon to view the balance sheet.) (Click the icon to view the income statement.) Read the requirements. Current Assets Property, Plant, and Equipment, Net Intangible Assets, Net Other Assets Total Assets $ 323,040 % 123,840 % 7,680 % 25,440 % $ 480,000 % Current Liabilities Long-term Liabilities Total Liabilities Stockholders' Equity Total Liabilities and Stockhold Requirement 2. Compare the cc $ 222,240 % 110,400 % 332,640 % 147,360 % 480,000 % higher formance and financial position with the average for the industry. lower Specialty's gross profit percentag n ratio are both the industry average, which indicates a(n) profit performance as compared with the industry. The company showed a slightly generally indicate a investment in fixed and intangible assets than the industry average. The company's percentage of debt to total assets is financial position than the average for the industry. than the industry, which would K The Specialty Department Stores, Inc. chief executive officer (CEO) has asked you to compare the company's profit performance and financial position with the averages for the industry. The CEO has given you the company's income statement and balance sheet as well as the industry average data for retailers. (Click the icon to view the income statement.) Read the requirements. (Click the icon to view the balance sheet.) Current Assets $ 323,040 L % Property, Plant, and Equipment, Net 123,840 % Intangible Assets, Net 7,680 % 25.440 Other Assets % $ 480,000 Total Assets % Current Liabilities $ 222,240 % 110,400 Long-term Liabilities % Total Liabilities 332,640 % 147,360 % Stockholders' Equity $ 480,000 Total Liabilities and Stockholders' Equity % Requirement 2. Compare the company's profit performance and financial position with the average for the industry. Specialty's gross profit percentage and profit margin ratio are both higher the industry average, which indicates a(n) profit performance as c lower industry. The company showed a slightly generally indicate a investment in fixed and intangible assets than the industry average. The company's percentage of debt to total assets is financial position than the average for the industry. than the industry, which would K The Specialty Department Stores, Inc. chief executive officer (CEO) has asked you to compare the company's profit performance and financial position with the averages for the industry. The CEO has given you the company's income statement and balance sheet as well as the industry average data for retailers. (Click the icon to view the balance sheet.) (Click the icon to view the income statement.) Read the requirements. Current Assets 323,040 % Property, Plant, and Equipment, Net 123,840 % Intangible Assets, Net 7,680 % 25,440 Other Assets % $ 480,000 Total Assets % Current Liabilities Long-term Liabilities Total Liabilities Stockholders' Equity Total Liabilities anc Requirement 2. Cor $ 222,240 % 110,400 % 332,640 % 147.360 % S 480,000 % uity s profit performance and financial position with the average for the industry. stronger Specialty's gross prc rofit margin ratio are both the industry average, which indicates a(n) profit performance as compared with the industry. weaker The company showe generally indicate a investment in fixed and intangible assets than the industry average. The company's percentage of debt to total assets is financial position than the average for the industry. than the industry, which would ts $ 323,040 % nt, and Equipment, Net sets, Net ilities iabilities ies s' Equity ies and Stockholders' Ed t 2. Compare the company ross profit percentage and y showed a slightly icate a D Data table Specialty Department Stores, Inc. Income Statement Compared with Industry Average Year Ended December 31, 2024 - X Industry Specialty Average Net Sales Revenue $ 780,000 100.0 % Cost of Goods Sold 524,160 65.8 Gross Profit 255,840 34.2 161,460 19.7 Operating Expenses Operating Income 94,380 14.5 7,020 0.4 Other Expenses financial $ 87,360 14.1% Net Income profit perf percentage of debt to to urrent Assets operty, Plant, and Equipment, tangible Assets, Net ther Assets otal Assets % 323,040 Data table Specialty Department Stores, Inc. Balance Sheet Compared with Industry Average - X final urrent Liabilities ong-term Liabilities Fotal Liabilities Stockholders' Equity Total Liabilities and Stockholders Requirement 2. Compare the comp Specialty's gross profit percentage The company showed a slightly generally indicate a Current Assets December 31, 2024 Property, Plant, and Equipment, Net Intangible Assets, Net Other Assets Industry Specialty Average $ 323,040 70.9% 123,840 23.6 7,680 0.8 25,440 4.7 profit perform $ 480,000 100.0 % Total Assets entage of debt to total Current Liabilities $ 222,240 48.1 % 110,400 16.6 Long-term Liabilities Total Liabilities 332,640 64.7 147,360 35.3 Stockholders' Equity Total Liabilities and Stockholders' $ 480,000 100.0 % Equity Print Done The Specialty Department Stores, Inc. chief executive officer (CEO) has asked you to compare the company's profit performance and financial posi the company's income statement and balance sheet as well as the industry average data for retailers. (Click the icon to view the income statement.) (Click the icon to view the balance sheet.) Read the requirements. Requirements $ 323,040 % Current Assets Property, Plant, and Equipm Intangible Assets, Net Other Assets Total Assets Requirements Current Liabilities Long-term Liabilities Total Liabilities Stockholders' Equity Total Liabilities and Stockho Requirement 2. Compare the 1. Prepare a vertical analysis for Specialty for both its income statement and balance sheet. 2. Compare the company's profit performance and financial position with the average for the industry. Print Done - x Specialty's gross profit percentage and profit margin ratio are both the industry average, which indicates a(n) profit p The company showed a slightly investment in fixed and intangible assets than the industry average. The company's percentage of debt t generally indicate a financial position than the average for the industry. The Specialty Department Stores, Inc. chief executive officer (CEO) has asked you to compare the company's profit performance and financial position with the averages for the industry. The CEO has given you the company's income statement and balance sheet as well as the industry average data for retailers Requirement 1. Prepare a vertical analysis for Specialty for both its income statement and balance sheet. Begin by preparing a vertical analysis for Specialty for its income statement. (Round the percent of total amounts to one decimal place, XX, and do not enter the %. For example, enter 10.1% as 10.1) Specialty Department Stores, Inc. Income Statement Year Ended December 31, 2024 Amount Percent of Total Net Sales Revenue $ 780,000 524,160 Cost of Goods Sold % Gross Profit 255,840 161,460 Operating Expenses Operating Income 94,380 Other Expenses Net Income 7,020 87,360 Prepare a vertical analysis for Specialty for its balance sheet (Round the percent of total amounts to one decimal place, XX, and do not enter the %. For example, enter 10 1% as 10.1.) K The Specialty Department Stores, Inc. chief executive officer (CEO) has asked you to compare the company's profit performance and financial position with the averages for the industry. The CEO has given you the company's income statement and balance sheet as well as the industry average data for retailers. (Click the icon to view the balance sheet.) (Click the icon to view the income statement.) Read the requirements. Prepare a vertical analysis for Specialty for its balance sheet. (Round the percent of total amounts to one decimal place, X.X, and do not enter the %. For example, enter 10.1% as 10.1.) Specialty Department Stores, Inc. Balance Sheet December 31, 2024 Amount Percent of Total Current Assets $ 323,040 % Property, Plant, and Equipment, Net 123,840 % Intangible Assets, Net 7,680 % 25,440 % Other Assets $ 480,000 % Total Assets Current Liabilities Long-term Liabilities $ 222,240 % 110,400 % 332,640 % Total Liabilities 147,360 I % Stockholders' Equity $ 480,000 % Total Liabilities and Stockholders' Equity K The Specialty Department Stores, Inc. chief executive officer (CEO) has asked you to compare the company's profit performance and financial position with the averages for the industry. The CEO has given you the company's income statement and balance sheet as well as the industry average data for retailers. (Click the icon to view the balance sheet.) BEE (Click the icon to view the income statement.) Read the requirements. Current Assets $ 323,040 Property, Plant, and Equipment, Net 123,840 7,680 Do do do % % % Intangible Assets, Net 25,440 % Other Assets $ 480,000 % Total Assets Current Liabilities $ 222,240 % 110,400 Long-term Liabilities % Total Liabilities 332,640 % 147,360 Stockholders' Equity % $ 480,000 Total Liabilities and Stockholders' Equity % Requirement 2. Compare the company's profit performance and financial position with the average for the industry. Specialty's gross profit percentage and profit margin ratio are both the industry average, which indicates a(n) profit performance as compared with the industry. The company showed a slightly generally indicate a investment in fixed and intangible assets than the industry average. The company's percentage of debt to total assets is financial position than the average for the industry. than the industry, which would The Specialty Department Stores, Inc. chief executive officer (CEO) has asked you to compare the company's profit performance and financial position with the averages for the industry. The CEO has given you the company's income statement and balance sheet as well as the industry average data for retailers. (Click the icon to view the balance sheet.) (Click the icon to view the income statement.) Read the requirements. Current Assets $ 323,040 % Property, Plant, and Equipment, Net 123,840 % Intangible Assets, Net 7,680 % 25,440 Other Assets % $ 480,000 Total Assets % Current Liabilities Long-term Liabilities $ 222,240 110,400 Total Liabilities 332,640 higher than Stockholders' Equity $ 147,360 480,000 less than Total Liabilities and Stockholders' Equity the same as Requirement 2. Compare the company's profit performance and fir average for the industry. the industry average, which indicates a(n) Specialty's gross profit percentage and profit margin ratio are both The company showed a slightly generally indicate a profit performance as compared with the industry. than the industry, which would investment in fixed and intangible assets than the industry average. The company's percentage of debt to total assets is financial position than the average for the industry. K The Specialty Department Stores, Inc. chief executive officer (CEO) has asked you to compare the company's profit performance and financial position with the averages for the industry. The CEO has given you the company's income statement and balance sheet as well as the industry average data for retailers. (Click the icon to view the balance sheet.) BEE (Click the icon to view the income statement.) Read the requirements. Current Assets Property, Plant, and Equipment, Net Intangible Assets, Net Other Assets Total Assets $ 323,040 % 123,840 % 7,680 % 25,440 % $ 480,000 % Current Liabilities $ 222,240 % 110,400 Long-term Liabilities % Total Liabilities 332,640 % 147,360 % Stockholders' Equity $ 480,000 % Total Liabilities and Stockholders' Equity comparable favorable Requirement 2. Compare the company's profit performance and financial position with the average for the industry. Specialty's gross profit percentage and profit margin ratio are both unfavorable the industry average, which indicates a(n) profit performance as compared with the industry. The company showed a slightly generally indicate a investment in fixed and intangible assets than the industry average. The company's percentage of debt to total assets is financial position than the average for the industry. than the industry, which would K The Specialty Department Stores, Inc. chief executive officer (CEO) has asked you to compare the company's profit performance and financial position with the averages for the industry. The CEO has given you the company's income statement and balance sheet as well as the industry average data for retailers. (Click the icon to view the balance sheet.) (Click the icon to view the income statement.) Read the requirements. Current Assets Property, Plant, and Equipment, Net Intangible Assets, Net Other Assets Total Assets $ 323,040 % 123,840 % 7,680 % 25,440 % $ 480,000 % Current Liabilities Long-term Liabilities Total Liabilities Stockholders' Equity Total Liabilities and Stockhold Requirement 2. Compare the cc $ 222,240 % 110,400 % 332,640 % 147,360 % 480,000 % higher formance and financial position with the average for the industry. lower Specialty's gross profit percentag n ratio are both the industry average, which indicates a(n) profit performance as compared with the industry. The company showed a slightly generally indicate a investment in fixed and intangible assets than the industry average. The company's percentage of debt to total assets is financial position than the average for the industry. than the industry, which would K The Specialty Department Stores, Inc. chief executive officer (CEO) has asked you to compare the company's profit performance and financial position with the averages for the industry. The CEO has given you the company's income statement and balance sheet as well as the industry average data for retailers. (Click the icon to view the income statement.) Read the requirements. (Click the icon to view the balance sheet.) Current Assets $ 323,040 L % Property, Plant, and Equipment, Net 123,840 % Intangible Assets, Net 7,680 % 25.440 Other Assets % $ 480,000 Total Assets % Current Liabilities $ 222,240 % 110,400 Long-term Liabilities % Total Liabilities 332,640 % 147,360 % Stockholders' Equity $ 480,000 Total Liabilities and Stockholders' Equity % Requirement 2. Compare the company's profit performance and financial position with the average for the industry. Specialty's gross profit percentage and profit margin ratio are both higher the industry average, which indicates a(n) profit performance as c lower industry. The company showed a slightly generally indicate a investment in fixed and intangible assets than the industry average. The company's percentage of debt to total assets is financial position than the average for the industry. than the industry, which would K The Specialty Department Stores, Inc. chief executive officer (CEO) has asked you to compare the company's profit performance and financial position with the averages for the industry. The CEO has given you the company's income statement and balance sheet as well as the industry average data for retailers. (Click the icon to view the balance sheet.) (Click the icon to view the income statement.) Read the requirements. Current Assets 323,040 % Property, Plant, and Equipment, Net 123,840 % Intangible Assets, Net 7,680 % 25,440 Other Assets % $ 480,000 Total Assets % Current Liabilities Long-term Liabilities Total Liabilities Stockholders' Equity Total Liabilities anc Requirement 2. Cor $ 222,240 % 110,400 % 332,640 % 147.360 % S 480,000 % uity s profit performance and financial position with the average for the industry. stronger Specialty's gross prc rofit margin ratio are both the industry average, which indicates a(n) profit performance as compared with the industry. weaker The company showe generally indicate a investment in fixed and intangible assets than the industry average. The company's percentage of debt to total assets is financial position than the average for the industry. than the industry, which would ts $ 323,040 % nt, and Equipment, Net sets, Net ilities iabilities ies s' Equity ies and Stockholders' Ed t 2. Compare the company ross profit percentage and y showed a slightly icate a D Data table Specialty Department Stores, Inc. Income Statement Compared with Industry Average Year Ended December 31, 2024 - X Industry Specialty Average Net Sales Revenue $ 780,000 100.0 % Cost of Goods Sold 524,160 65.8 Gross Profit 255,840 34.2 161,460 19.7 Operating Expenses Operating Income 94,380 14.5 7,020 0.4 Other Expenses financial $ 87,360 14.1% Net Income profit perf percentage of debt to to urrent Assets operty, Plant, and Equipment, tangible Assets, Net ther Assets otal Assets % 323,040 Data table Specialty Department Stores, Inc. Balance Sheet Compared with Industry Average - X final urrent Liabilities ong-term Liabilities Fotal Liabilities Stockholders' Equity Total Liabilities and Stockholders Requirement 2. Compare the comp Specialty's gross profit percentage The company showed a slightly generally indicate a Current Assets December 31, 2024 Property, Plant, and Equipment, Net Intangible Assets, Net Other Assets Industry Specialty Average $ 323,040 70.9% 123,840 23.6 7,680 0.8 25,440 4.7 profit perform $ 480,000 100.0 % Total Assets entage of debt to total Current Liabilities $ 222,240 48.1 % 110,400 16.6 Long-term Liabilities Total Liabilities 332,640 64.7 147,360 35.3 Stockholders' Equity Total Liabilities and Stockholders' $ 480,000 100.0 % Equity Print Done The Specialty Department Stores, Inc. chief executive officer (CEO) has asked you to compare the company's profit performance and financial posi the company's income statement and balance sheet as well as the industry average data for retailers. (Click the icon to view the income statement.) (Click the icon to view the balance sheet.) Read the requirements. Requirements $ 323,040 % Current Assets Property, Plant, and Equipm Intangible Assets, Net Other Assets Total Assets Requirements Current Liabilities Long-term Liabilities Total Liabilities Stockholders' Equity Total Liabilities and Stockho Requirement 2. Compare the 1. Prepare a vertical analysis for Specialty for both its income statement and balance sheet. 2. Compare the company's profit performance and financial position with the average for the industry. Print Done - x Specialty's gross profit percentage and profit margin ratio are both the industry average, which indicates a(n) profit p The company showed a slightly investment in fixed and intangible assets than the industry average. The company's percentage of debt t generally indicate a financial position than the average for the industry.
Expert Answer:

Posted Date:
Students also viewed these finance questions
-
The Specialty Department Stores, Inc. chief executive officer (CEO) has asked you to compare the companys profit performance and financial position with the averages for the industry. The CEO has...
-
The McConnell Department Stores, Inc. chief executive officer (CEO) has asked you to compare the companys profit performance and financial position with the averages for the industry. The CEO has...
-
The following are selected account balances from Cheela Company and Jarjar Corporation as of December 31, 2018: Cheela Jarjar Revenues P 980,000 P 560,000 Expenses 560,000 420,000 Dividend Income...
-
Assume that you are a project manager charged with developing the implementation plan to switch from driving on the right side of the road to the left. Which conversion approach would you use and why?
-
The circuit diagram shows a battery connected to five lamps. The currents in lamps A and B are shows. Write down the current flowing in a. lamp C, b. lamp E. 3 amperes A B 2 amperes D
-
Lakeview Development Corporation was formed on January 2, 19X0, to develop a vacation-recreation area upon land purchased the same day by the corporation for \(\$ 100,000\). The corporation also...
-
Jones Wholesale Company has been one of the fastest growing wholesale firms in the United States for the last five years in terms of sales and profits. The firm has maintained a current ratio above...
-
label y(t)? .x(t) 1 A. B. Find graphically y(t) = x(t)* h(t) Sketch and h(t) -T T t T B. Sketch and label (show your work in reaching the final result) f(1-0.5t)? f(t) t -1 0 2 C. determine whether...
-
In delivering digital content, why is it important to "Know Your Audience?" What happens when it doesn't happen? What are techniques you can use to know your audience with they could be anyone and...
-
Indicate whether each of the following statements is true or false by writing T or F in the answer c olumn. Words or terms that become a common part of the language are referred to as generic.
-
Why was the limited exemption from antitrust laws so crucial to the development of the NFL?
-
1. You have just started a new company to deliver mail and parcels to rural communities. At the moment, other companies either do not provide a service or are exceptionally expensive. The new company...
-
Indicate whether each of the following statements is true or false by writing T or F in the answer c olumn. The Green Giant is an example of a trade name.
-
Why cant Premier League teams like Arsenal exert as much monopoly power as the NFL's Chicago Bears?
-
A company purchased a truck on October 1 of the current year at a cost of $40,000. The truck is expected to last six years and has a salvage value of $2,200. The company's annual accounting period...
-
Dawson Companys balance sheet information at the end of 2019 and 2020 is as follows: Additional information: The company did not issue any common stock during 2020. Required : Next Level Fill in the...
-
If \(x\) and \(y\) are statistically independent, then \(E[x y]=E[x] E[y]\). That is, the expected value of the product \(x y\) is equal to the product of the separate mean values. If \(z=x+y\),...
-
What are the bounds on the correlation coefficient?
-
True or False. The mean square value of \(x(t)\) can be determined as \(E\left[x^{2} ight]=R(0)\).

Study smarter with the SolutionInn App