

Thinking back to high school or first year chemistry, you may recall how to calculate mole...
Fantastic news! We've Found the answer you've been seeking!
Question:
Transcribed Image Text:
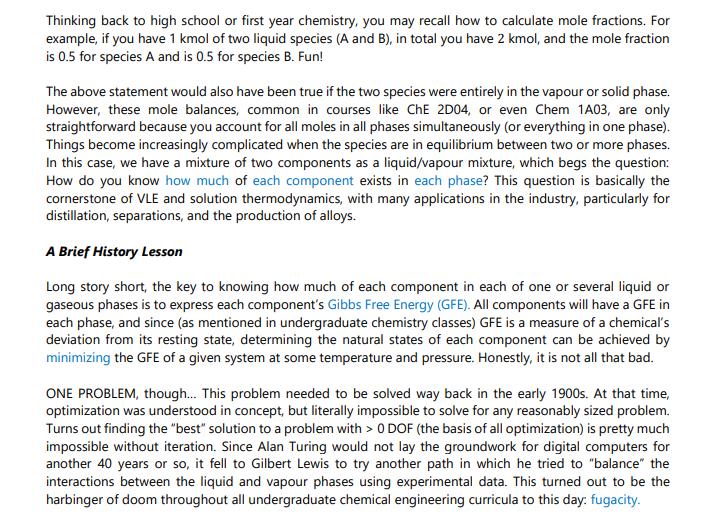
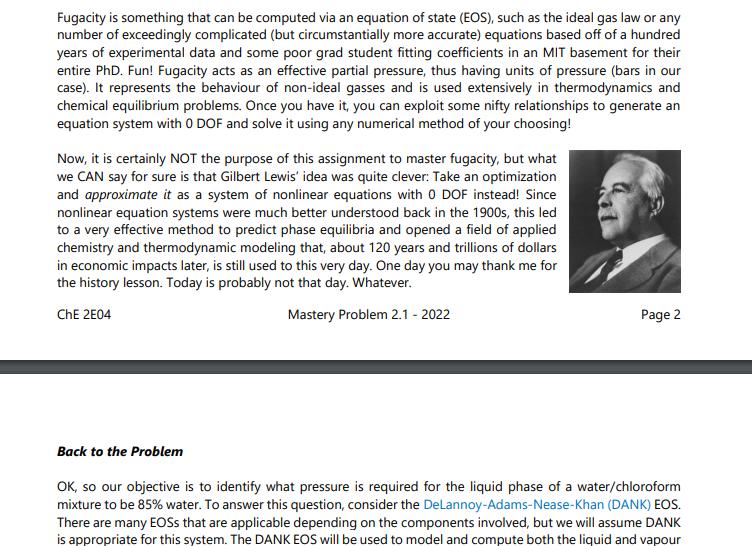
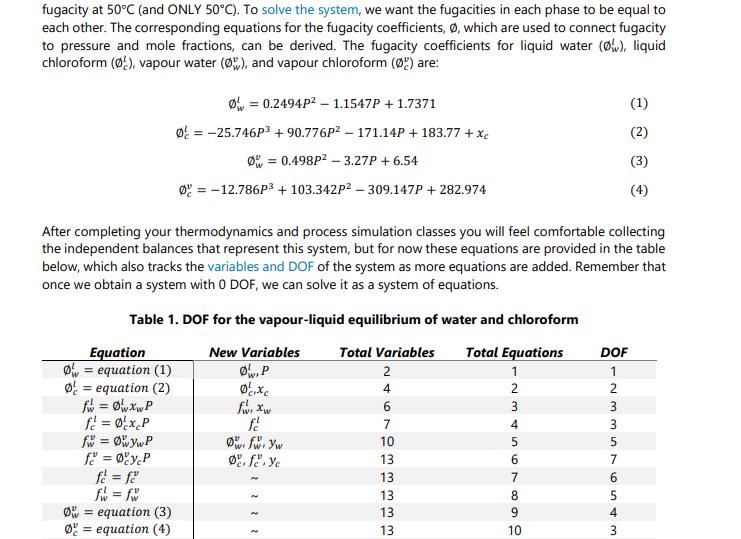
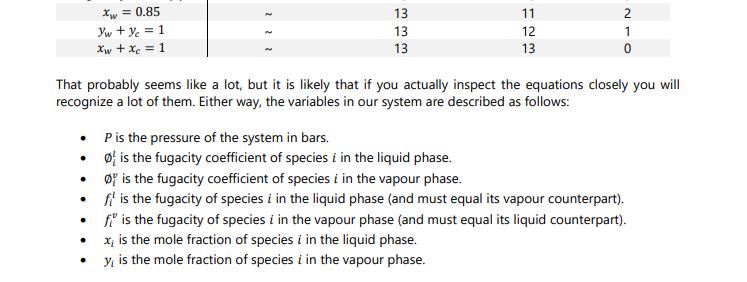
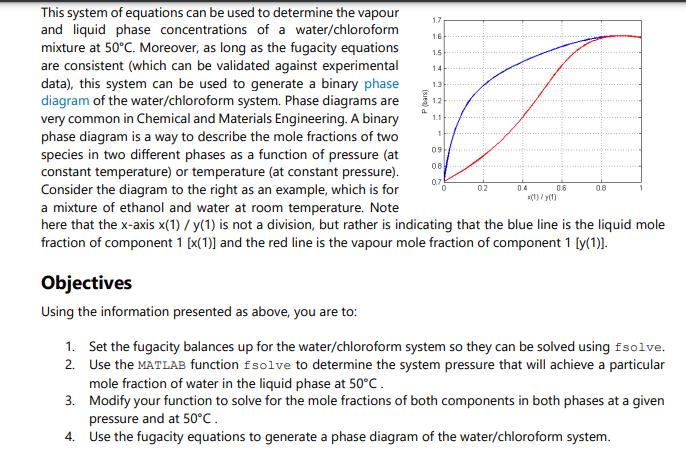
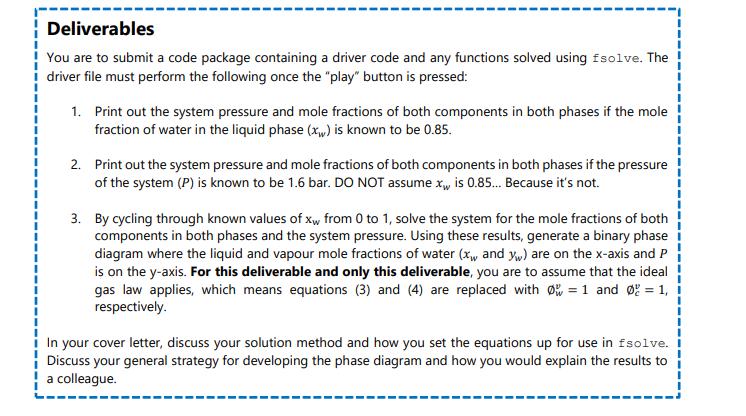
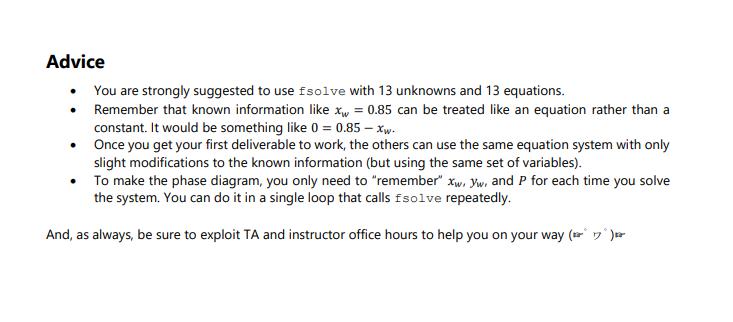
Thinking back to high school or first year chemistry, you may recall how to calculate mole fractions. For example, if you have 1 kmol of two liquid species (A and B), in total you have 2 kmol, and the mole fraction is 0.5 for species A and is 0.5 for species B. Fun! The above statement would also have been true if the two species were entirely in the vapour or solid phase. However, these mole balances, common in courses like ChE 2D04, or even Chem 1A03, are only straightforward because you account for all moles in all phases simultaneously (or everything in one phase). Things become increasingly complicated when the species are in equilibrium between two or more phases. In this case, we have a mixture of two components as a liquid/vapour mixture, which begs the question: How do you know how much of each component exists in each phase? This question is basically the cornerstone of VLE and solution thermodynamics, with many applications in the industry, particularly for distillation, separations, and the production of alloys. A Brief History Lesson Long story short, the key to knowing how much of each component in each of one or several liquid or gaseous phases is to express each component's Gibbs Free Energy (GFE). All components will have a GFE in each phase, and since (as mentioned in undergraduate chemistry classes) GFE is a measure of a chemical's deviation from its resting state, determining the natural states of each component can be achieved by minimizing the GFE of a given system at some temperature and pressure. Honestly, it is not all that bad. ONE PROBLEM, though... This problem needed to be solved way back in the early 1900s. At that time, optimization was understood in concept, but literally impossible to solve for any reasonably sized problem. Turns out finding the "best" solution to a problem with > O DOF (the basis of all optimization) is pretty much impossible without iteration. Since Alan Turing would not lay the groundwork for digital computers for another 40 years or so, it fell to Gilbert Lewis to try another path in which he tried to "balance" the interactions between the liquid and vapour phases using experimental data. This turned out to be the harbinger of doom throughout all undergraduate chemical engineering curricula to this day: fugacity. Fugacity is something that can be computed via an equation of state (EOS), such as the ideal gas law or any number of exceedingly complicated (but circumstantially more accurate) equations based off of a hundred years of experimental data and some poor grad student fitting coefficients in an MIT basement for their entire PhD. Fun! Fugacity acts as an effective partial pressure, thus having units of pressure (bars in our case). It represents the behaviour of non-ideal gasses and is used extensively in thermodynamics and chemical equilibrium problems. Once you have it, you can exploit some nifty relationships to generate an equation system with 0 DOF and solve it using any numerical method of your choosing! Now, it is certainly NOT the purpose of this assignment to master fugacity, but what we CAN say for sure is that Gilbert Lewis' idea was quite clever: Take an optimization and approximate it as a system of nonlinear equations with 0 DOF instead! Since nonlinear equation systems were much better understood back in the 1900s, this led to a very effective method to predict phase equilibria and opened a field of applied chemistry and thermodynamic modeling that, about 120 years and trillions of dollars in economic impacts later, is still used to this very day. One day you may thank me for the history lesson. Today is probably not that day. Whatever. ChE 2E04 Mastery Problem 2.1 - 2022 Back to the Problem Page 2 OK, so our objective is to identify what pressure is required for the liquid phase of a water/chloroform mixture to be 85% water. To answer this question, consider the DeLannoy-Adams-Nease-Khan (DANK) EOS. There are many EOSS that are applicable depending on the components involved, but we will assume DANK is appropriate for this system. The DANK EOS will be used to model and compute both the liquid and vapour fugacity at 50°C (and ONLY 50°C). To solve the system, we want the fugacities in each phase to be equal to each other. The corresponding equations for the fugacity coefficients, Ø, which are used to connect fugacity to pressure and mole fractions, can be derived. The fugacity coefficients for liquid water (Ø), liquid chloroform (Ø), vapour water (Ø), and vapour chloroform (Ø) are: Equation O equation (1) Ø = equation (2) fw = 0w xwP f² = 0xcP fw = ØwywP f = ØyP fe = fe f = fw Ø = 0.2494P² 1.1547P + 1.7371 0 = -25.746P³ +90.776P²-171.14P + 183.77 + Xc Ø = 0.498P² -3.27P + 6.54 0 = -12.786P³ + 103.342P² - 309.147P + 282.974 After completing your thermodynamics and process simulation classes you will feel comfortable collecting the independent balances that represent this system, but for now these equations are provided in the table below, which also tracks the variables and DOF of the system as more equations are added. Remember that once we obtain a system with 0 DOF, we can solve it as a system of equations. Table 1. DOF for the vapour-liquid equilibrium of water and chloroform New Variables Ø, P O equation (3) Ø equation (4) cixc fwr xw fé Ow: fwr yw Defe. Yc ܐ ܐ ܐ ܐ Total Variables Total Equations 1 246 4 7 10 13 13 13 13 13 568493546 10 DOF - N 336 in 4 m 1 2 5 7 5 (1) 3 (3) (4) • P is the pressure of the system in bars. . . Xw = 0.85 yw + y = 1 Xw + Xc = 1 . That probably seems like a lot, but it is likely that if you actually inspect the equations closely you will recognize a lot of them. Either way, the variables in our system are described as follows: ● 13 13 13 11 12 13 123 2 1 0 is the fugacity coefficient of species i in the liquid phase. Ø is the fugacity coefficient of species i in the vapour phase. fi is the fugacity of species i in the liquid phase (and must equal its vapour counterpart). fi is the fugacity of species i in the vapour phase (and must equal its liquid counterpart). x₁ is the mole fraction of species i in the liquid phase. y, is the mole fraction of species i in the vapour phase. This system of equations can be used to determine the vapour and liquid phase concentrations of a water/chloroform mixture at 50°C. Moreover, as long as the fugacity equations are consistent (which can be validated against experimental data), this system can be used to generate a binary phase diagram of the water/chloroform system. Phase diagrams are very common in Chemical and Materials Engineering. A binary phase diagram is a way to describe the mole fractions of two species in two different phases as a function of pressure (at constant temperature) or temperature (at constant pressure). Consider the diagram to the right as an example, which is for a mixture of ethanol and water at room temperature. Note here that the x-axis x(1) / y(1) is not a division, but rather is indicating that the blue line is the liquid mole fraction of component 1 [x(1)] and the red line is the vapour mole fraction of component 1 [y(1)]. Objectives Using the information presented as above, you are to: P (bar) 1.7 16 1.4 1.3 1 09 0.8 0.7 0 0.2 0.6 (1)/y(1) 0.8 1. Set the fugacity balances up for the water/chloroform system so they can be solved using fsolve. 2. Use the MATLAB function fsolve to determine the system pressure that will achieve a particular mole fraction of water in the liquid phase at 50°C. 3. Modify your function to solve for the mole fractions of both components in both phases at a given pressure and at 50°C. 4. Use the fugacity equations to generate a phase diagram of the water/chloroform system. Deliverables You are to submit a code package containing a driver code and any functions solved using fsolve. The driver file must perform the following once the "play" button is pressed: 1. Print out the system pressure and mole fractions of both components in both phases if the mole fraction of water in the liquid phase (x) is known to be 0.85. 2. Print out the system pressure and mole fractions of both components in both phases if the pressure of the system (P) is known to be 1.6 bar. DO NOT assume x is 0.85... Because it's not. 3. By cycling through known values of xw from 0 to 1, solve the system for the mole fractions of both components in both phases and the system pressure. Using these results, generate a binary phase diagram where the liquid and vapour mole fractions of water (x, and yw) are on the x-axis and P is on the y-axis. For this deliverable and only this deliverable, you are to assume that the ideal gas law applies, which means equations (3) and (4) are replaced with 0 = 1 and 0 = 1, respectively. In your cover letter, discuss your solution method and how you set the equations up for use in fsolve. Discuss your general strategy for developing the phase diagram and how you would explain the results to a colleague. Advice • You are strongly suggested to use fsolve with 13 unknowns and 13 equations. ● Remember that known information like xw = 0.85 can be treated like an equation rather than a constant. It would be something like 0 = 0.85 - xw. Once you get your first deliverable to work, the others can use the same equation system with only slight modifications to the known information (but using the same set of variables). • To make the phase diagram, you only need to "remember" xw, yw, and P for each time you solve the system. You can do it in a single loop that calls fsolve repeatedly. And, as always, be sure to exploit TA and instructor office hours to help you on your way ( ) . Thinking back to high school or first year chemistry, you may recall how to calculate mole fractions. For example, if you have 1 kmol of two liquid species (A and B), in total you have 2 kmol, and the mole fraction is 0.5 for species A and is 0.5 for species B. Fun! The above statement would also have been true if the two species were entirely in the vapour or solid phase. However, these mole balances, common in courses like ChE 2D04, or even Chem 1A03, are only straightforward because you account for all moles in all phases simultaneously (or everything in one phase). Things become increasingly complicated when the species are in equilibrium between two or more phases. In this case, we have a mixture of two components as a liquid/vapour mixture, which begs the question: How do you know how much of each component exists in each phase? This question is basically the cornerstone of VLE and solution thermodynamics, with many applications in the industry, particularly for distillation, separations, and the production of alloys. A Brief History Lesson Long story short, the key to knowing how much of each component in each of one or several liquid or gaseous phases is to express each component's Gibbs Free Energy (GFE). All components will have a GFE in each phase, and since (as mentioned in undergraduate chemistry classes) GFE is a measure of a chemical's deviation from its resting state, determining the natural states of each component can be achieved by minimizing the GFE of a given system at some temperature and pressure. Honestly, it is not all that bad. ONE PROBLEM, though... This problem needed to be solved way back in the early 1900s. At that time, optimization was understood in concept, but literally impossible to solve for any reasonably sized problem. Turns out finding the "best" solution to a problem with > O DOF (the basis of all optimization) is pretty much impossible without iteration. Since Alan Turing would not lay the groundwork for digital computers for another 40 years or so, it fell to Gilbert Lewis to try another path in which he tried to "balance" the interactions between the liquid and vapour phases using experimental data. This turned out to be the harbinger of doom throughout all undergraduate chemical engineering curricula to this day: fugacity. Fugacity is something that can be computed via an equation of state (EOS), such as the ideal gas law or any number of exceedingly complicated (but circumstantially more accurate) equations based off of a hundred years of experimental data and some poor grad student fitting coefficients in an MIT basement for their entire PhD. Fun! Fugacity acts as an effective partial pressure, thus having units of pressure (bars in our case). It represents the behaviour of non-ideal gasses and is used extensively in thermodynamics and chemical equilibrium problems. Once you have it, you can exploit some nifty relationships to generate an equation system with 0 DOF and solve it using any numerical method of your choosing! Now, it is certainly NOT the purpose of this assignment to master fugacity, but what we CAN say for sure is that Gilbert Lewis' idea was quite clever: Take an optimization and approximate it as a system of nonlinear equations with 0 DOF instead! Since nonlinear equation systems were much better understood back in the 1900s, this led to a very effective method to predict phase equilibria and opened a field of applied chemistry and thermodynamic modeling that, about 120 years and trillions of dollars in economic impacts later, is still used to this very day. One day you may thank me for the history lesson. Today is probably not that day. Whatever. ChE 2E04 Mastery Problem 2.1 - 2022 Back to the Problem Page 2 OK, so our objective is to identify what pressure is required for the liquid phase of a water/chloroform mixture to be 85% water. To answer this question, consider the DeLannoy-Adams-Nease-Khan (DANK) EOS. There are many EOSS that are applicable depending on the components involved, but we will assume DANK is appropriate for this system. The DANK EOS will be used to model and compute both the liquid and vapour fugacity at 50°C (and ONLY 50°C). To solve the system, we want the fugacities in each phase to be equal to each other. The corresponding equations for the fugacity coefficients, Ø, which are used to connect fugacity to pressure and mole fractions, can be derived. The fugacity coefficients for liquid water (Ø), liquid chloroform (Ø), vapour water (Ø), and vapour chloroform (Ø) are: Equation O equation (1) Ø = equation (2) fw = 0w xwP f² = 0xcP fw = ØwywP f = ØyP fe = fe f = fw Ø = 0.2494P² 1.1547P + 1.7371 0 = -25.746P³ +90.776P²-171.14P + 183.77 + Xc Ø = 0.498P² -3.27P + 6.54 0 = -12.786P³ + 103.342P² - 309.147P + 282.974 After completing your thermodynamics and process simulation classes you will feel comfortable collecting the independent balances that represent this system, but for now these equations are provided in the table below, which also tracks the variables and DOF of the system as more equations are added. Remember that once we obtain a system with 0 DOF, we can solve it as a system of equations. Table 1. DOF for the vapour-liquid equilibrium of water and chloroform New Variables Ø, P O equation (3) Ø equation (4) cixc fwr xw fé Ow: fwr yw Defe. Yc ܐ ܐ ܐ ܐ Total Variables Total Equations 1 246 4 7 10 13 13 13 13 13 568493546 10 DOF - N 336 in 4 m 1 2 5 7 5 (1) 3 (3) (4) • P is the pressure of the system in bars. . . Xw = 0.85 yw + y = 1 Xw + Xc = 1 . That probably seems like a lot, but it is likely that if you actually inspect the equations closely you will recognize a lot of them. Either way, the variables in our system are described as follows: ● 13 13 13 11 12 13 123 2 1 0 is the fugacity coefficient of species i in the liquid phase. Ø is the fugacity coefficient of species i in the vapour phase. fi is the fugacity of species i in the liquid phase (and must equal its vapour counterpart). fi is the fugacity of species i in the vapour phase (and must equal its liquid counterpart). x₁ is the mole fraction of species i in the liquid phase. y, is the mole fraction of species i in the vapour phase. This system of equations can be used to determine the vapour and liquid phase concentrations of a water/chloroform mixture at 50°C. Moreover, as long as the fugacity equations are consistent (which can be validated against experimental data), this system can be used to generate a binary phase diagram of the water/chloroform system. Phase diagrams are very common in Chemical and Materials Engineering. A binary phase diagram is a way to describe the mole fractions of two species in two different phases as a function of pressure (at constant temperature) or temperature (at constant pressure). Consider the diagram to the right as an example, which is for a mixture of ethanol and water at room temperature. Note here that the x-axis x(1) / y(1) is not a division, but rather is indicating that the blue line is the liquid mole fraction of component 1 [x(1)] and the red line is the vapour mole fraction of component 1 [y(1)]. Objectives Using the information presented as above, you are to: P (bar) 1.7 16 1.4 1.3 1 09 0.8 0.7 0 0.2 0.6 (1)/y(1) 0.8 1. Set the fugacity balances up for the water/chloroform system so they can be solved using fsolve. 2. Use the MATLAB function fsolve to determine the system pressure that will achieve a particular mole fraction of water in the liquid phase at 50°C. 3. Modify your function to solve for the mole fractions of both components in both phases at a given pressure and at 50°C. 4. Use the fugacity equations to generate a phase diagram of the water/chloroform system. Deliverables You are to submit a code package containing a driver code and any functions solved using fsolve. The driver file must perform the following once the "play" button is pressed: 1. Print out the system pressure and mole fractions of both components in both phases if the mole fraction of water in the liquid phase (x) is known to be 0.85. 2. Print out the system pressure and mole fractions of both components in both phases if the pressure of the system (P) is known to be 1.6 bar. DO NOT assume x is 0.85... Because it's not. 3. By cycling through known values of xw from 0 to 1, solve the system for the mole fractions of both components in both phases and the system pressure. Using these results, generate a binary phase diagram where the liquid and vapour mole fractions of water (x, and yw) are on the x-axis and P is on the y-axis. For this deliverable and only this deliverable, you are to assume that the ideal gas law applies, which means equations (3) and (4) are replaced with 0 = 1 and 0 = 1, respectively. In your cover letter, discuss your solution method and how you set the equations up for use in fsolve. Discuss your general strategy for developing the phase diagram and how you would explain the results to a colleague. Advice • You are strongly suggested to use fsolve with 13 unknowns and 13 equations. ● Remember that known information like xw = 0.85 can be treated like an equation rather than a constant. It would be something like 0 = 0.85 - xw. Once you get your first deliverable to work, the others can use the same equation system with only slight modifications to the known information (but using the same set of variables). • To make the phase diagram, you only need to "remember" xw, yw, and P for each time you solve the system. You can do it in a single loop that calls fsolve repeatedly. And, as always, be sure to exploit TA and instructor office hours to help you on your way ( ) .
Expert Answer:

Related Book For 

Posted Date:
Students also viewed these chemical engineering questions
-
For the two vectors A and B in Fig. 1.37, (a) Find the scalar product A B, and (b) Find the magnitude and direction of the vector product A X B.
-
Calculate the elevations of points A and B in Problem 27.19.
-
The masses of blocks A and B in Fig. 5.86 are 20.0 kg and 10.0 kg, respectively. The blocks are initially at rest on the floor and are connected by a mass less string passing over a mass less and...
-
Prepare journal entries to record each of the following sales transactions of TFC Merchandising. TFC uses a perpetual inventory system and the gross method. May 1 9 Sold merchandise for $600, with...
-
Stellar Inc.s inventory records show 300 units on hand on November 1 with a unit cost of $4 each. The following transactions occurred during the month of November: All expenses other than cost of...
-
The periodic function shown in Fig. 15.32 is defined over its period as Find G(s) glt 0. 0 2 3 t
-
Constellation Brands, a U.S. company, purchases merchandise from a German supplier on a regular basis. On April 1, 2016, Constellation purchased 14,000 for delivery on June 30, 2016, in anticipation...
-
After six months of study, much political arm wrestling, and some serious financial analysis, Dr. Martin Starr, president of Southwestern University, had reached a decision. To the delight of its...
-
Ivanhoe Inc. had a bad year in 2021. For the first time in its history, it operated at a loss. The company's income statement showed the following results from selling 86,400 units of product: net...
-
Greg Gordon manages the 10,000-square-foot multilevel laser tag arena at LazerLite. This arena combines cutting-edge computer technology with action-oriented team play; in a futuristic environment...
-
A car dealer will sell you a $ 1 6 , 5 7 6 car of your dreams for 3 4 9 0 down and payments of 3 3 8 . 5 6 per month for 4 8 months what is the total amount paid for both car and financing
-
Inputs Used Low Med High 5 units 10 units 16 units Weather Net Return Excellent $50.95 $64.70 $56.40 Average $47.85 $58.50 $50.20 Poor $32.35 $21.30 $16.10 What action yields the highest expected net...
-
Were you aware that privately owned, for-profit banks have a noteworthy influence over the production of money? I'm curious to hear your thoughts on this matter. Have you acquired knowledge...
-
Generally, an increase in risk will result in ________. A. a higher return on investment C. a lower return on investment D. a lower required return or interest rate E. a higher required return or...
-
There can be problems interpreting this ratio due to -Select-risk, inflation or time particularly when an older firm is compared with a newer company. The total assets turnover ratio measures how...
-
Kristina took out a bank loan for $60 000 that must be repaid with regular monthly payments of $1100. The bank charges her an interest rate of 3.0%, compounded monthly. a) How many payments will...
-
Discuss the goals of a global supply chain security strategy. When should this type of strategy be developed? Provide references
-
You continue to work in the corporate office for a nationwide convenience store franchise that operates nearly 10,000 stores. The per- store daily customer count (i.e., the mean number of customers...
-
After the passage of several weeks during which Repo never got more than one high bid for a car, the Repo folks guessed that something was amiss. Some members of the board of directors proposed...
-
Evangeline and Gabriel met at a freshman mixer. They want desperately to meet each other again, but they forgot to exchange names or phone numbers when they met the first time. There are two possible...
-
Earl sells lemonade in a competitive market on a busy street corner in Philadelphia. His production function is f(x1, x2) = x11/3 x21/3, where output is measured in gallons, x1 is the number of...
-
Which of the following statements regarding budgets is false? a. They are formal documents that quantify a company's plans. b. They enhance communication and coordination. c. They are useful in...
-
Which of the following is a true statement regard ing the evaluation of an investment center? a. Return on investment may be high because of old equipment that is fully depreciated. b. Residual...
-
Which of the following is a problem in using re turn on investment to evaluate managers? a. Managers of investment centers with high ROIs may not invest in some projects with re turns greater than...

Study smarter with the SolutionInn App