

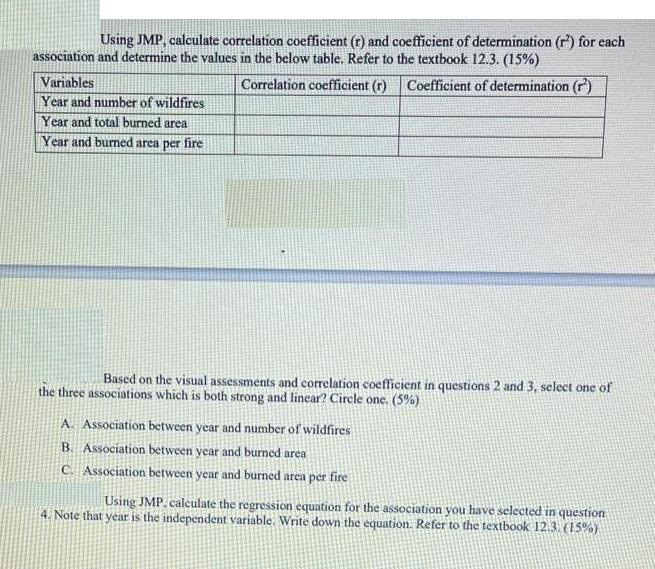
Using JMP, calculate correlation coefficient (r) and coefficient of determination (r) for each association and determine...
Fantastic news! We've Found the answer you've been seeking!
Question:

Expert Answer:
To calculate the correlation coefficient r and coefficient of determination r using JMP you would need to have the dataset and follow these steps 1 Op... View the full answer

Related Book For 
The Essentials Of Statistics A Tool For Social Research
ISBN: 9781111829568
3rd Edition
Authors: Joseph F. Healey
Posted Date:
