

Using the data for Johnson & Johnson (NYSE:JNJ), presented below: Johnson & Johnson Selected Financial Data...
Fantastic news! We've Found the answer you've been seeking!
Transcribed Image Text:
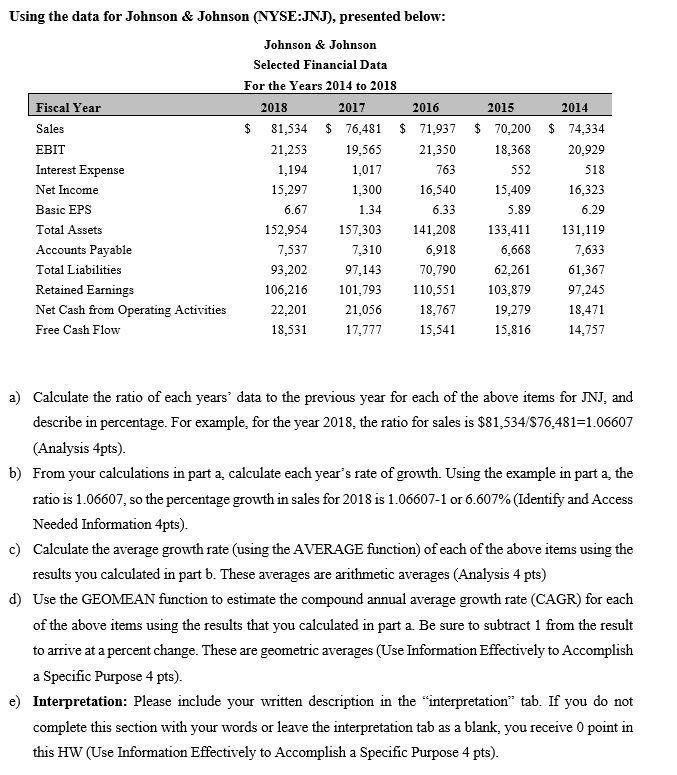
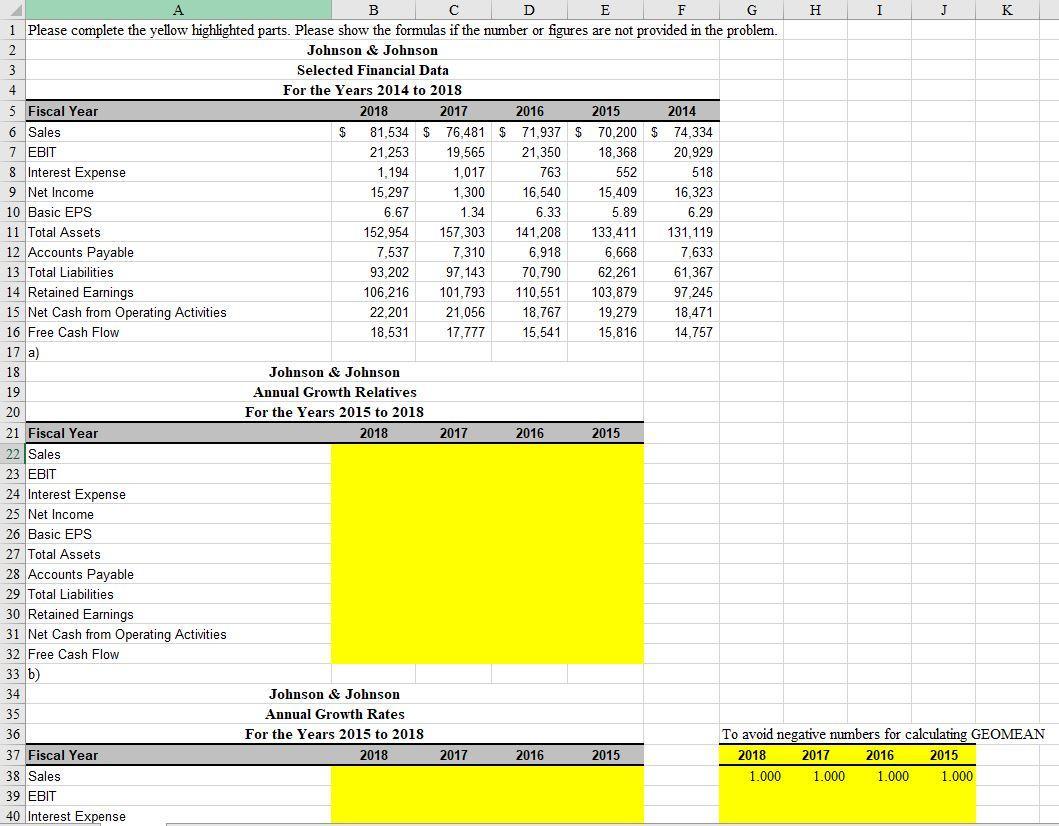
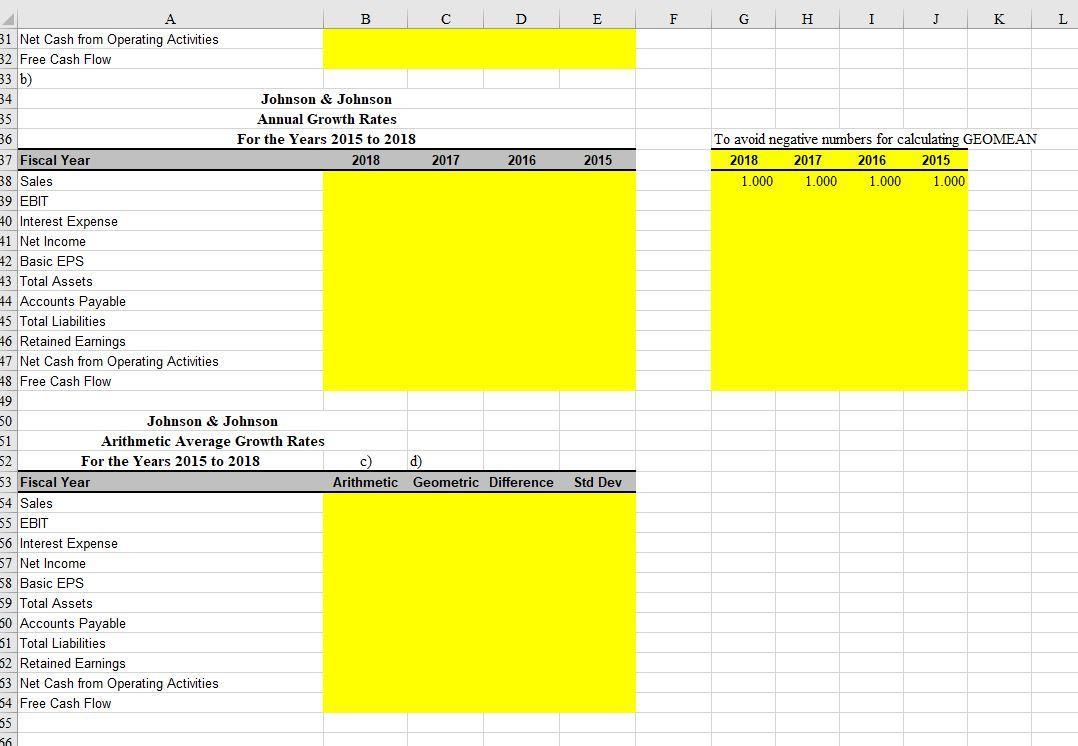
Using the data for Johnson & Johnson (NYSE:JNJ), presented below: Johnson & Johnson Selected Financial Data For the Years 2014 to 2018 Fiscal Year 2018 2017 2016 2015 2014 Sales $ 81,534 $ 76,481 $ 71,937 $ 70,200 $ 74,334 EBIT 21,253 19,565 21,350 18,368 20,929 Interest Expense 1,194 1,017 763 552 518 Net Income 15,297 1,300 16,540 15,409 16,323 Basic EPS 6.67 1.34 6.33 5.89 6.29 Total Assets 152,954 157,303 141,208 133,411 131,119 Accounts Payable 7,537 7,310 6,918 6,668 7,633 Total Liabilities 93,202 97,143 70,790 62,261 61,367 Retained Earnings 106,216 101,793 110,551 103,879 97,245 Net Cash from Operating Activities 22,201 21,056 18,767 19,279 18,471 Free Cash Flow 18,531 17,777 15,541 15,816 14,757 a) Calculate the ratio of each years' data to the previous year for each of the above items for JNJ, and describe in percentage. For example, for the year 2018, the ratio for sales is $81,534/S76,481=1.06607 (Analysis 4pts). b) From your calculations in part a, calculate each year's rate of growth. Using the example in part a, the ratio is 1.06607, so the percentage growth in sales for 2018 is 1.06607-1 or 6.607% (Identify and Access Needed Information 4pts). c) Calculate the average growth rate (using the AVERAGE function) of each of the above items using the results you calculated in part b. These averages are arithmetic averages (Analysis 4 pts) d) Use the GEOMEAN function to estimate the compound annual average growth rate (CAGR) for each of the above items using the results that you calculated in part a. Be sure to subtract 1 from the result to arrive at a percent change. These are geometric averages (Use Information Effectively to Accomplish a Specific Purpose 4 pts). e) Interpretation: Please include your written description in the "interpretation" tab. If you do not complete this section with your words or leave the interpretation tab as a blank, you receive 0 point in this HW (Use Information Effectively to Accomplish a Specific Purpose 4 pts). D A B E F G H I J K 1 Please complete the yellow highlighted parts. Please show the formulas if the number or figures are not provided in the problem. 2 Johnson & Johnson 3 Selected Financial Data 4 For the Years 2014 to 2018 5 Fiscal Year 2018 2017 2016 2015 2014 6 Sales 81,534 $ 76,481 $ 71,937 $ 70,200 $ 74,334 7 EBIT 8 Interest Expense 9 Net Income 10 Basic EPS 11 Total Assets 12 Accounts Payable 13 Total Liabilities 14 Retained Earnings 21,253 19,565 21,350 18,368 20,929 1,194 1,017 763 552 518 15,297 1,300 16,540 15,409 16,323 6.67 1.34 6.33 5.89 6.29 152,954 157,303 141.208 133,411 131,119 7,537 7,310 6,918 6,668 7,633 93,202 97,143 70.790 62,261 61,367 106,216 101,793 110,551 103,879 97,245 15 Net Cash from Operating Activities 22,201 21.056 18,767 19,279 18,471 16 Free Cash Flow 18,531 17,777 15,541 15,816 14.757 17 a) 18 Johnson & Johnson 19 Annual Growth Relatives 20 For the Years 2015 to 2018 21 Fiscal Year 2018 2017 2016 2015 22 Sales 23 EBIT 24 Interest Expense 25 Net Income 26 Basic EPS 27 Total Assets 28 Accounts Payable 29 Total Liabilities 30 Retained Earnings 31 Net Cash from Operating Activities 32 Free Cash Flow 33 b) 34 Johnson & Johnson 35 Annual Growth Rates 36 For the Years 2015 to 2018 To avoid negative numbers for calculating GEOMEAN 37 Fiscal Year 2018 2017 2016 2015 2018 2017 2016 2015 38 Sales 1.000 1.000 1.000 1.000 39 EBIT 40 Interest Expense A В E F H I J K L 31 Net Cash from Operating Activities 32 Free Cash Flow 33 b) 34 35 36 Johnson & Johnson Annual Growth Rates For the Years 2015 to 2018 To avoid negative mumbers for calculating GEOMEAN 37 Fiscal Year 38 Sales 39 ЕBIT 2018 2017 2016 2015 2018 2017 2016 2015 1.000 1.000 1.000 1.000 40 Interest Expense 41 Net Income 42 Basic EPS 43 Total Assets 44 Accounts Payable 45 Total Liabilities 46 Retained Earnings 47 Net Cash from Operating Activities 48 Free Cash Flow 49 50 51 Johnson & Johnson Arithmetic Average Growth Rates 52 For the Years 2015 to 2018 c) d) 53 Fiscal Year Arithmetic Geometric Difference Std Dev 54 Sales 55 EBIT 56 Interest Expense 57 Net Income 58 Basic EPS 59 Total Assets 30 Accounts Payable 51 Total Liabilities 52 Retained Earnings 33 Net Cash from Operating Activities 54 Free Cash Flow 35 Using the data for Johnson & Johnson (NYSE:JNJ), presented below: Johnson & Johnson Selected Financial Data For the Years 2014 to 2018 Fiscal Year 2018 2017 2016 2015 2014 Sales $ 81,534 $ 76,481 $ 71,937 $ 70,200 $ 74,334 EBIT 21,253 19,565 21,350 18,368 20,929 Interest Expense 1,194 1,017 763 552 518 Net Income 15,297 1,300 16,540 15,409 16,323 Basic EPS 6.67 1.34 6.33 5.89 6.29 Total Assets 152,954 157,303 141,208 133,411 131,119 Accounts Payable 7,537 7,310 6,918 6,668 7,633 Total Liabilities 93,202 97,143 70,790 62,261 61,367 Retained Earnings 106,216 101,793 110,551 103,879 97,245 Net Cash from Operating Activities 22,201 21,056 18,767 19,279 18,471 Free Cash Flow 18,531 17,777 15,541 15,816 14,757 a) Calculate the ratio of each years' data to the previous year for each of the above items for JNJ, and describe in percentage. For example, for the year 2018, the ratio for sales is $81,534/S76,481=1.06607 (Analysis 4pts). b) From your calculations in part a, calculate each year's rate of growth. Using the example in part a, the ratio is 1.06607, so the percentage growth in sales for 2018 is 1.06607-1 or 6.607% (Identify and Access Needed Information 4pts). c) Calculate the average growth rate (using the AVERAGE function) of each of the above items using the results you calculated in part b. These averages are arithmetic averages (Analysis 4 pts) d) Use the GEOMEAN function to estimate the compound annual average growth rate (CAGR) for each of the above items using the results that you calculated in part a. Be sure to subtract 1 from the result to arrive at a percent change. These are geometric averages (Use Information Effectively to Accomplish a Specific Purpose 4 pts). e) Interpretation: Please include your written description in the "interpretation" tab. If you do not complete this section with your words or leave the interpretation tab as a blank, you receive 0 point in this HW (Use Information Effectively to Accomplish a Specific Purpose 4 pts). D A B E F G H I J K 1 Please complete the yellow highlighted parts. Please show the formulas if the number or figures are not provided in the problem. 2 Johnson & Johnson 3 Selected Financial Data 4 For the Years 2014 to 2018 5 Fiscal Year 2018 2017 2016 2015 2014 6 Sales 81,534 $ 76,481 $ 71,937 $ 70,200 $ 74,334 7 EBIT 8 Interest Expense 9 Net Income 10 Basic EPS 11 Total Assets 12 Accounts Payable 13 Total Liabilities 14 Retained Earnings 21,253 19,565 21,350 18,368 20,929 1,194 1,017 763 552 518 15,297 1,300 16,540 15,409 16,323 6.67 1.34 6.33 5.89 6.29 152,954 157,303 141.208 133,411 131,119 7,537 7,310 6,918 6,668 7,633 93,202 97,143 70.790 62,261 61,367 106,216 101,793 110,551 103,879 97,245 15 Net Cash from Operating Activities 22,201 21.056 18,767 19,279 18,471 16 Free Cash Flow 18,531 17,777 15,541 15,816 14.757 17 a) 18 Johnson & Johnson 19 Annual Growth Relatives 20 For the Years 2015 to 2018 21 Fiscal Year 2018 2017 2016 2015 22 Sales 23 EBIT 24 Interest Expense 25 Net Income 26 Basic EPS 27 Total Assets 28 Accounts Payable 29 Total Liabilities 30 Retained Earnings 31 Net Cash from Operating Activities 32 Free Cash Flow 33 b) 34 Johnson & Johnson 35 Annual Growth Rates 36 For the Years 2015 to 2018 To avoid negative numbers for calculating GEOMEAN 37 Fiscal Year 2018 2017 2016 2015 2018 2017 2016 2015 38 Sales 1.000 1.000 1.000 1.000 39 EBIT 40 Interest Expense A В E F H I J K L 31 Net Cash from Operating Activities 32 Free Cash Flow 33 b) 34 35 36 Johnson & Johnson Annual Growth Rates For the Years 2015 to 2018 To avoid negative mumbers for calculating GEOMEAN 37 Fiscal Year 38 Sales 39 ЕBIT 2018 2017 2016 2015 2018 2017 2016 2015 1.000 1.000 1.000 1.000 40 Interest Expense 41 Net Income 42 Basic EPS 43 Total Assets 44 Accounts Payable 45 Total Liabilities 46 Retained Earnings 47 Net Cash from Operating Activities 48 Free Cash Flow 49 50 51 Johnson & Johnson Arithmetic Average Growth Rates 52 For the Years 2015 to 2018 c) d) 53 Fiscal Year Arithmetic Geometric Difference Std Dev 54 Sales 55 EBIT 56 Interest Expense 57 Net Income 58 Basic EPS 59 Total Assets 30 Accounts Payable 51 Total Liabilities 52 Retained Earnings 33 Net Cash from Operating Activities 54 Free Cash Flow 35
Expert Answer:
Answer rating: 100% (QA)
B C E F Computation of all the ratios A B E F 1 2018 2017 2016 ... View the full answer

Related Book For 

Accounting
ISBN: 978-0324662962
23rd Edition
Authors: Jonathan E. Duchac, James M. Reeve, Carl S. Warren
Posted Date:
Students also viewed these accounting questions
-
On January 1, 2021, Bobcat Company sold 10% bonds having a face value of $300,000 to yield 12% market rate. The bonds are dated January 1, 2021 and mature in 5 years, with interest payable...
-
Develop an Excel model for Robert's Chiropractic Clinic - use the scenario provided below. Robert Berns runs a Chiropractic Clinic in Belle Jardin in St. Louis. His annual fixed operating costs are...
-
Perform a full competitive analysis for Company B strategy, the competitiveness of a company's prices and costs, and evaluating the strengths and of a company's closest competitors C and H. Please be...
-
EX: let X ~ B (5, 0.4) X ~ B (7, 004) Xz ~ B ( 7 0.2) Find the dist. of Now Noint cik Date. 2 No. R X) q X + X 3 X + X
-
Now assume that Lube Oil has a return on equity of 5% and a cost of equity of 10%. As a stockholder in Lube Oil, would you want the firm to change its dividend policy? Why or why not?
-
State the two categories of circumstances that determine the overall level of assurance and list the factors that the auditor can use to indicate the degree to which each category exists.
-
Imagine that you see an advertisement for Manic Wesley's Used Car Emporium that reads something like this: "\($10,000\) Instant Credit! Seven Years to Pay! Low, Low Monthly Payments: Only \($231.99\)...
-
Walker Company has 15,000 shares of common stock outstanding during all of 2007. It also has two convertible securities outstanding at the end of 2007. These are: 1. Convertible preferred stock:...
-
Bill and sue will file a joint 2024 tax return and they will report the following income.What is the total Met investment income Tax that they will owe for the next year.interest payments paid by...
-
In a survey, adults were asked to answer yes or no to the question Do you regularly watch the evening TV news? Some of the results from the survey are detailed in the Venn diagram opposite. One adult...
-
2. Use Dijkstra's algorithin to find the shortest route between node 1 and every other node in the network of Figure 6.18. 2 6. 5 1 6. 7 3 FIGURE 6.18 Network for Problem 2, Set 6.3b 2.
-
What strategies are most effective in optimizing organizational skills within high-complexity environments, and how do these strategies affect overall productivity and efficiency ?
-
(1). Please convert the following MIPS code shown below into C code. add $to, $0, $0 add St2, SO, SO addi Ss0, $0, 3 labell: slt St1, St0,Ss0 beq St1, SO, label2 addi St2, St2, 2 addi St0, St0, 1 j...
-
Morpeth Ltd. began 2020 with retained earnings of $12 million. Revenues during the year were $37 million and expenses totalled $26 million. Morpeth declared dividends of $8 million. What was the...
-
A diving board is held by two pillars (see image below). The board is 2.4 m long and has a total mass of 8 kg. The pillars are separated by a distance d = 0.9 m. What is the force on the second...
-
How to create a relational model from DDL statements and how you save a relational model design.?
-
Superior Company provided the following data for the year ended December 31 (all raw materials are used in production as direct materials): Selling expenses Purchases of raw materials Direct labor...
-
Assume that your audit team has established the following parameters for the examination of ELM's sales transactions: LO G-3 Risk of incorrect acceptance...
-
Bunyon Lumber Company incurs a cost of $490 per hundred board feet in processing certain rough-cut lumber, which it sells for $635 per hundred board feet. An alternative is to produce a finished cut...
-
Daan Corporation wholesales repair products to equipment manufacturers. On March 1, 2010, Daan Corporation issued $24,000,000 of five-year, 12% bonds at an effective interest rate of 10%, receiving...
-
Your boss has suggested that a one-year payback period is the same as a 100% average rate of return. Do you agree?
-
a) Calculate the absolute difference and relative difference from this data. Sales Food Beverage Total Absolute Relative Year 1 Year 2 difference difference % 678,950 787,582 378,450 280,053...
-
What is the cash operating cycle and how is it calculated?
-
What are the key elements of working capital?

Study smarter with the SolutionInn App