

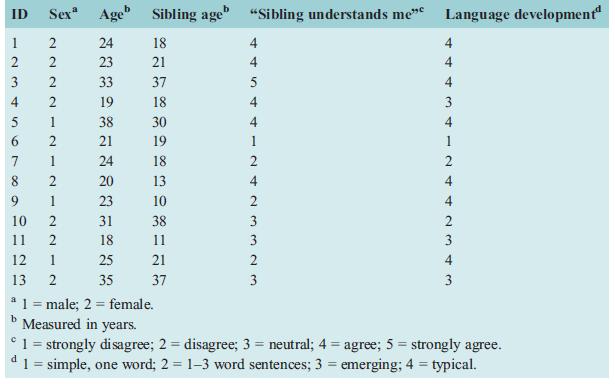
Using the data in Table 3.1, make a frequency table and a histogram for the language development
Question:
Using the data in Table 3.1, make a frequency table and a histogram for the language development variable data in the Waite et al. (2015) study.
Table 3.1
Fantastic news! We've Found the answer you've been seeking!
Step by Step Answer:
ANSWER To create a frequency table and a histogram for the language development variable data in ...View the full answer

Answered By
Surendar Kumaradevan
I have worked with both teachers and students to offer specialized help with everything from grammar and vocabulary to challenging problem-solving in a range of academic disciplines. For each student's specific needs, I can offer explanations, examples, and practice tasks that will help them better understand complex ideas and develop their skills.
I employ a range of techniques and resources in my engaged, interesting tutoring sessions to keep students motivated and on task. I have the tools necessary to offer students the support and direction they require in order to achieve, whether they need assistance with their homework, test preparation, or simply want to hone their skills in a particular subject area.
0 Reviews
10+ Question Solved
Related Book For 
Statistics For The Social Sciences A General Linear Model Approach
ISBN: 9781107576971
1st Edition
Authors: Russell T. Warne
Question Posted:
