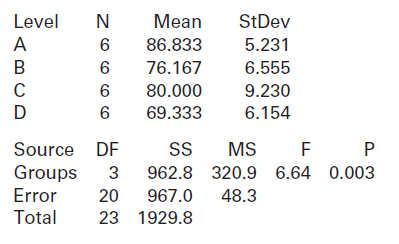
Test for a difference in population means between groups A and D. Show all details of the
Question:
Refer to the data with analysis shown in the following computer output:
Transcribed Image Text:
Level N Mean StDev A 86.833 5.231 76.167 6.555 80.000 9.230 D 69.333 6.154 Source DF Groups SS MS 3 962.8 320.9 6.64 0.003 Error 20 967.0 48.3 Total 23 1929.8
Fantastic news! We've Found the answer you've been seeking!
Step by Step Answer:
Answer rating: 66% (6 reviews)
We are testing H 0 A D vs H a A D The test statistic is This is a twotail test so the pvalue is t...View the full answer
Answered By
Omar ELmoursi
I'm Omar, I have Bachelor degree in Business and Finance, My unique approach is to help students with questions and assignments, I can teach Business, Math, Accounting, Managerial Accounting, Economy, Human resources management, organizational behavior, project management, I have experience dealing with different types of students and teach them how to deal with different types of exercises.
5.00+
4+ Reviews
10+ Question Solved
Related Book For
Statistics Unlocking The Power Of Data
ISBN: 9780470601877
1st Edition
Authors: Robin H. Lock, Patti Frazer Lock, Kari Lock Morgan, Eric F. Lock, Dennis F. Lock
Question Posted:
Students also viewed these Mathematics questions
-
Test for a difference in population means between groups A and C. Show all details of the test. Refer to the data with analysis shown in the following computer output: Level N Mean StDev 10.200 2.864...
-
Test for a difference in population means between groups A and B. Show all details of the test. Refer to the data with analysis shown in the following computer output: Level N Mean StDev A 86.833...
-
Test for a difference in population means between groups B and D. Show all details of the test. Refer to the data with analysis shown in the following computer output: Level N Mean StDev A 86.833...
-
Due to acid rain, the percentage of lakes in Scandinavia that lost their population of brown trout increased dramatically between 1940 and 1975. Based on a sample of 2850 lakes, this percentage can...
-
Each year, Forbes magazine publishes a list of the richest people in the United States. As of September 16, 2013, the six richest Americans and their wealth (to the nearest billion dollars) are as...
-
Baxter Video Productss sales are expected to increase by 20% from $5 million in 2010 to $6 million in 2011. Its assets totaled $3 million at the end of 2010. Baxter is already at full capacity, so...
-
For the goodness-of-fit test to be valid, each of the _______________ frequencies must be at least 5. In Exercises 9 and 10, fill in each blank with the appropriate word or phrase.
-
An aqueous slum? at 30?C containing 20.0 wt% solids is fed to an evaporator in which enough water is vaporized at 1 atm to produce a product slurry containing 35.0 wt% solids. Heat is supplied to the...
-
organization with which you are familiar to use for this assignment. This could include a current or previous employer. Complete Parts 1 and 2 below. Part 1: DIKW Model Graphic Create a graphical...
-
Sean Cleary and Stephen Foerster wrote this case solely to provide material for class discussion. The authors do not intend to illustrate either effective or ineffective handling of a managerial...
-
Find a 95% confidence interval for the difference in the means of populations C and D. Refer to the data with analysis shown in the following computer output: Level N Mean StDev A 86.833 5.231 76.167...
-
The ANOVA table in Example 8.3 on page 496 for the SandwichAnts data indicates that there is a difference in mean number of ants among the three types of sandwich fillings. In Examples 8.8 and 8.9 we...
-
What is the representative firms goal?
-
2) What are the four major categories of mortgages?
-
Singer-songwriter Mirella Cesa from Guayaquil, Ecuador, is known as the Mother of Andipop. Watch the music video for Cesa's 2017 single "La corriente" and read more about Mirella Cesa and her music....
-
Q1) Compute the product by inspection 1 0 0] [2 0 16 11. 0 0 12. 0 0 21. 0 0 5 3 0 0 0 6 -1 19. 0 7 -4 0 0 - -1 0 0 3 0 0 0 2 0 0 5 0 0 0 4 0 0 7 0 0 0 1 2 -5 0 4 -3 4 -2 1 'C Q2) Determine by...
-
If a suit is worth $ 2430 today and inflation in the year was 4.75%, how much did the same suit cost a year ago?
-
What are the key features of a mortgage?
-
a. Your roommate says, Sales taxes are reported as an expense in the income statement. Do you agree? Explain. b. Jensen Company has cash proceeds from sales of $8,400. This amount includes $400 of...
-
Explain why it is not wise to accept a null hypothesis.
-
A statistics professor was in the process of comparing the pass rates (the percentage of entering students who graduate in 5 years or less) for B.A.s, B.B.A.s, B.Sc.s, and B.Eng.s. Delving into the...
-
Refer to Exercise 6.59. In exercise 6.59 Given the following probabilities, compute all joint probabilities. P(A) = .9 P(A c ) = .1 P(B/A) = .4 P(B/A c ) Determine P(A / B).
-
Refer to Exercise 6.60. In exercise 6.60 Determine all joint probabilities from the following. P(A) = .8 P(A c ) = .2 P(B\A) = .4 P(B\A c ) = .7 Find the following. a. P(A | B) b. P(A C | B) c. P(A |...
-
For each of the following: identify all critical numbers and use these to determine all region(s) where the function is increasing as well as all region(s) where the function is decreasing. Then...
-
Determine the most suitable data structure for the above graph and show it adjacency representation. (5 markah/marks)
-
The table gives the outdoor temperatures observed by a science student on a spring day. Draw a graph of the data, and find the average rate of change of temperature between the following times: a)...
Study smarter with the SolutionInn App