Question:
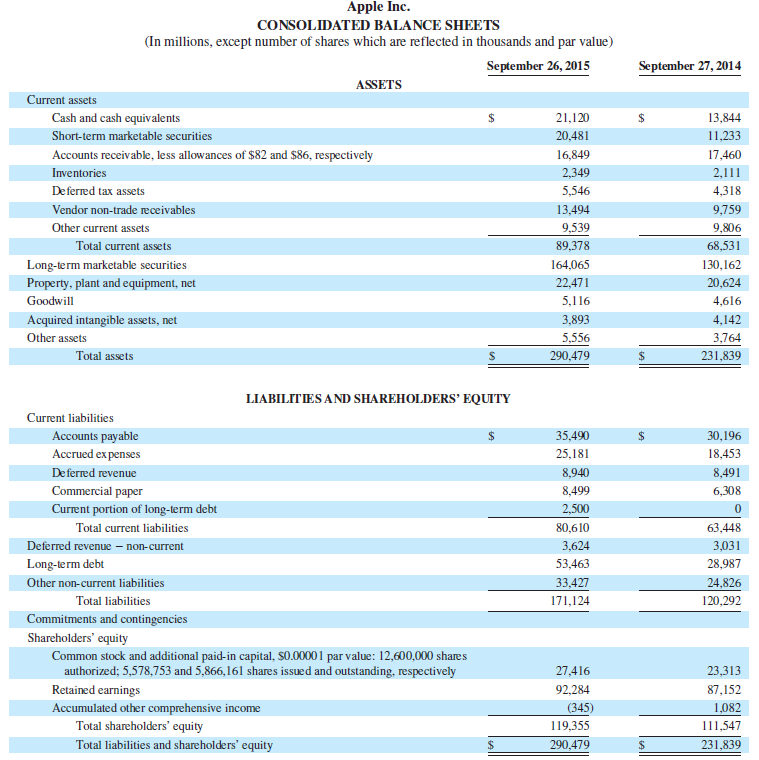
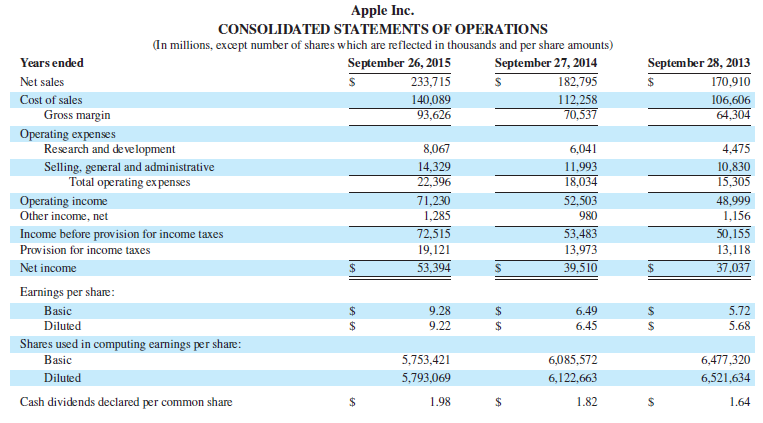
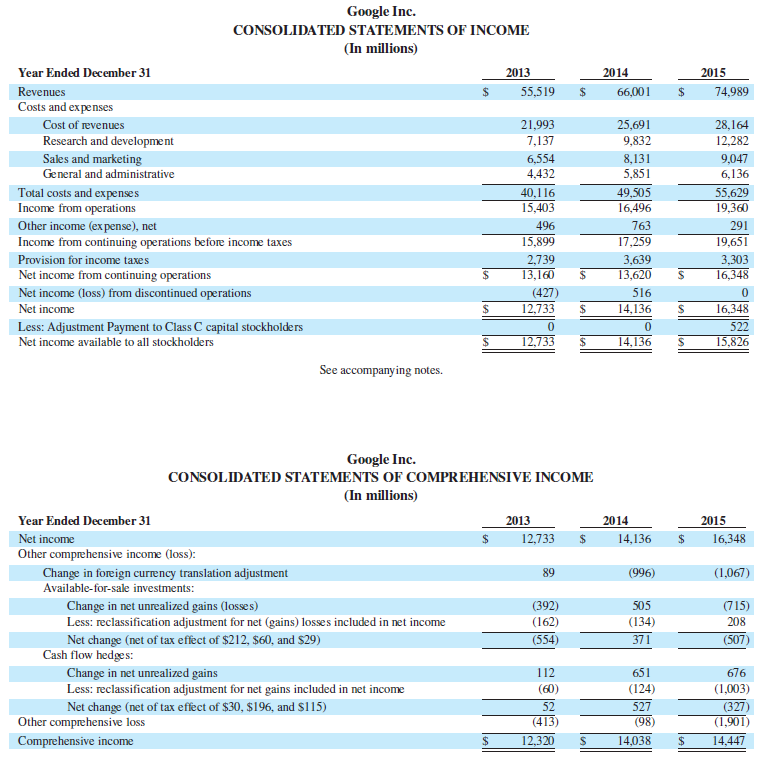
Apple's and Google's income statements in Appendix A both show increasing sales and cost of sales. The gross margin ratio can be used to analyze how well companies control costs as sales increase.
Required
1. Compute the gross margin ratio for Apple for each of the three most recent years.
2. Compute the gross margin ratio for Google for each of the three most recent years.
3. Do your computed gross margin ratios indicate good cost control for each company? Explain.
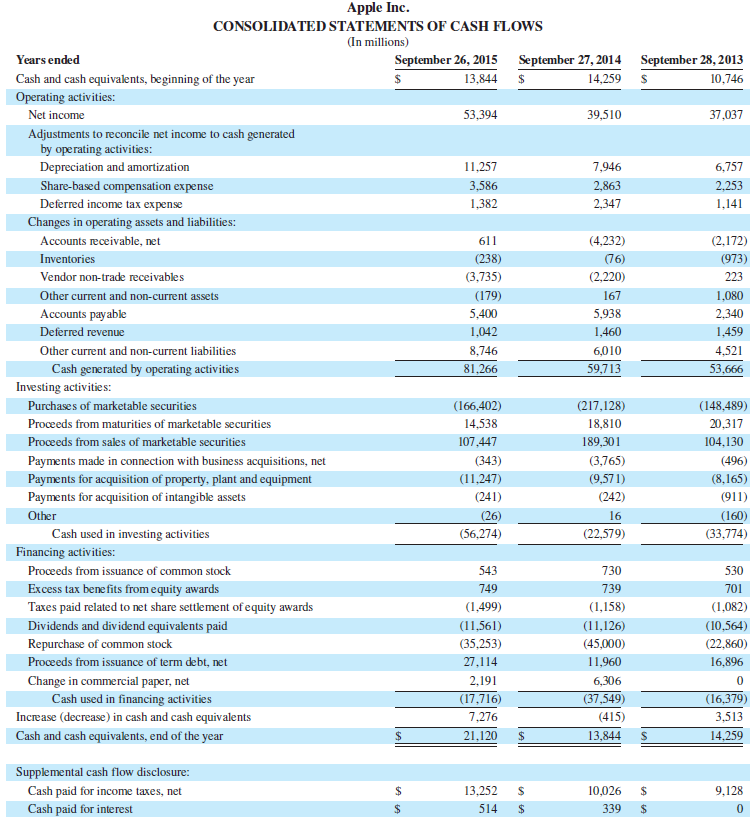
Apple's financial statements in Appendix A
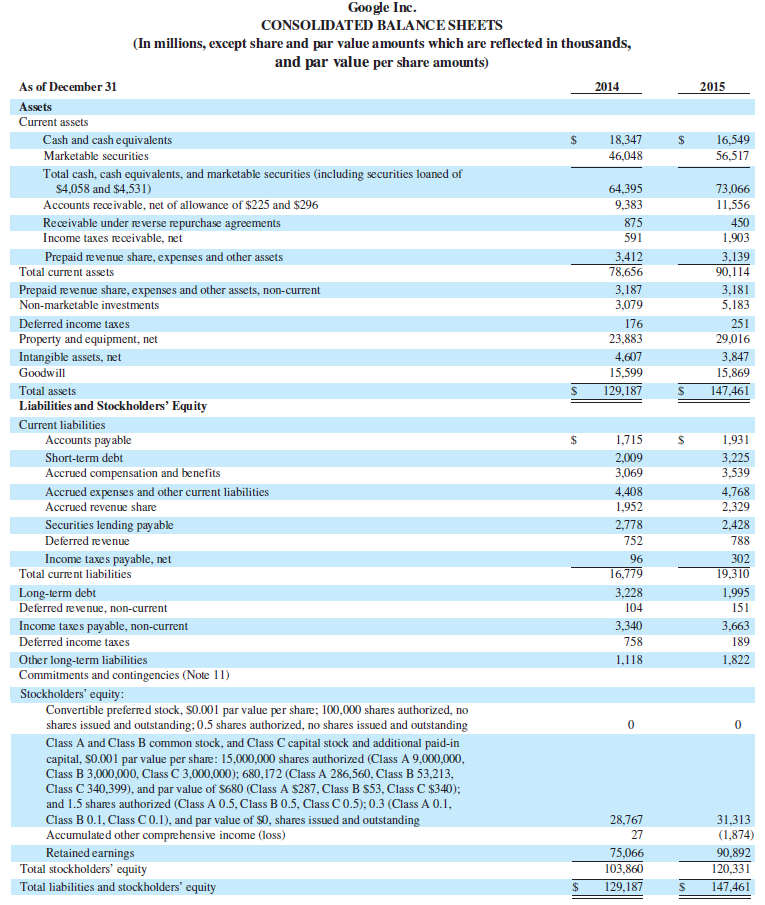
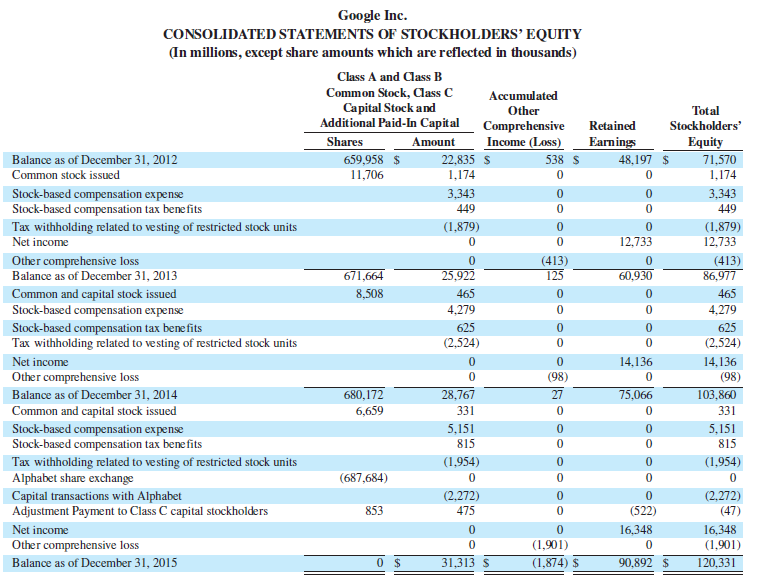
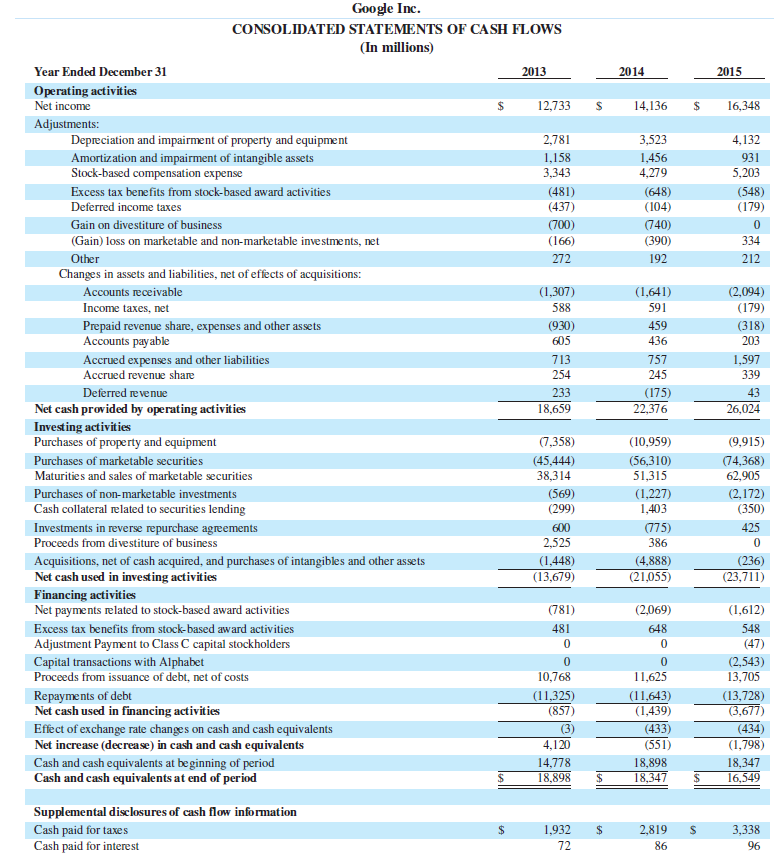
Google's financial statements from Appendix A.
Financial Statements
Financial statements are the standardized formats to present the financial information related to a business or an organization for its users. Financial statements contain the historical information as well as current period’s financial...
Transcribed Image Text:
Apple Inc. CONSOLIDATED BALANCE SHEETS (In millions, except number of shares which are reflected in thousands and par value) September 26, 2015 September 27, 2014 ASSETS Current assets Cash and cash equivalents %24 21,120 2$ 13,844 11,233 Short-term marketable securities 20,481 Accounts receivable, less allowances of $82 and $86, respectively 16,849 17,460 Inventories 2,349 2,111 De ferred tax assets 5,546 4,318 9,759 Vendor non-trade receivables 13,494 9,539 Other current assets 9,806 Total current assets 89,378 68,531 Long-term marketable securities 164,065 130,162 Property, plant and equipment, net 22,471 20,624 Goodwill 5,116 4,616 Acquired intangible assets, net 3,893 4,142 3,764 Other assets 5,556 Total assets 290,479 %24 231,839 LIABILITIES AND SHAREHOLDERS' EQUITY Current liabilities Accounts payable Accrued ex penses %24 35,490 %24 30,196 25,181 18,453 De ferred revenue 8,940 8,491 Commercial paper 8,499 6,308 Current portion of long-term debt 2,500 Total current liabilities 80,610 63,448 Deferred revenue – non-current 3,624 3,031 Long-term debt 53,463 28,987 Other non-current liabilities 24,826 33,427 Total liabilities 171,124 120,292 Commitments and contingencies Shareholders' equity Common stock and additional paid-in capital, S0.00001 par value: 12,600,000 shares authorized; 5,578,753 and 5,866,161 shares issued and outstanding, respectively 27,416 23,313 87,152 Retained earnings Accumulated other comprehensive income Total shareholders' equity Total liabilities and shareholders' equity 92,284 (345) 1,082 119,355 111,547 290,479 %24 231,839


