

Question: Below are the tables you analyzed with chi square in problem 10.16. As you recall, these are the results of a survey of 748 voters
Below are the tables you analyzed with chi square in problem 10.16. As you recall, these are the results of a survey of 748 voters in a large city concerning how they voted in the 2008 presidential election. Use column percentages, the maximum difference, and an appropriate measure of association to analyze these relationships. Summarize the results of your analysis in a paragraph that describes the strength and pattern of each relationship. Based on the chi square test, you already knew if these relationships were statistically significant. What new information do the statistics introduced in this chapter add to your understanding of these relationships?
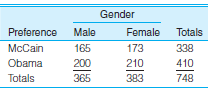
a. Presidential preference and gender:
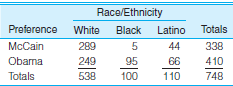
b. Presidential preference and race/ethnicity:
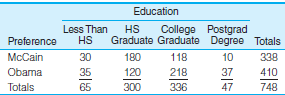
c. Presidential preference by education:
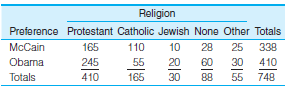
d. Presidential preference by religion:
Gender Preference Male Female Totals McCain 165 173 338 Obama 200 210 410 Totals 365 383 748
Step by Step Solution
3.31 Rating (160 Votes )
There are 3 Steps involved in it
a Maximum difference 003 Phi 000 Lambda 000 b ... View full answer

Get step-by-step solutions from verified subject matter experts
Document Format (1 attachment)
757-M-S-H-T (4567).docx
120 KBs Word File