

Question: Figure 2-28 shows two diagrams (A and B), both of which are legitimate ways to represent that a stock has a history of many prices.
Figure 2-28 shows two diagrams (A and B), both of which are legitimate ways to represent that a stock has a history of many prices. Which of the two diagrams do you consider a better way to model this situation and why?
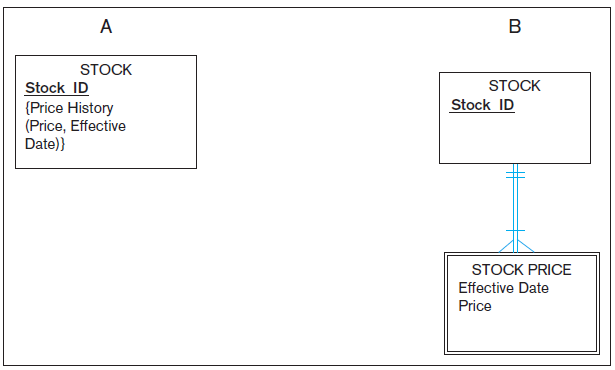
A STOCK Stock ID {Price History (Price, Effective Date)} STOCK Stock ID STOCK PRICE Effective Date Price
Step by Step Solution
★★★★★
3.40 Rating (172 Votes )
There are 3 Steps involved in it
1 Expert Approved Answer
Step: 1 Unlock

The crux of the answer relies upon what the purpose of the ER diagram is for the modeling situation ... View full answer
Question Has Been Solved by an Expert!
Get step-by-step solutions from verified subject matter experts
Step: 2 Unlock
Step: 3 Unlock
Document Format (1 attachment)
613-CS-DB (1602).docx
120 KBs Word File