

Question: From the following graph, determine the equation of the linear trend line for time- share sales for Glib Marketing, Inc. Annual Sales, Glib Sales, Inc.
From the following graph, determine the equation of the linear trend line for time- share sales for Glib Marketing, Inc.
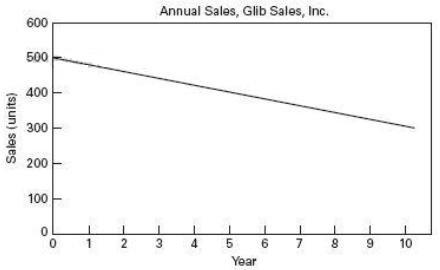
Annual Sales, Glib Sales, Inc. 600 500 400 2 300 D 200 100 1 0 2345 6 7 89 10 Year
Step by Step Solution
★★★★★
3.34 Rating (160 Votes )
There are 3 Steps involved in it
1 Expert Approved Answer
Step: 1 Unlock

Slope of the line is ... View full answer
Question Has Been Solved by an Expert!
Get step-by-step solutions from verified subject matter experts
Step: 2 Unlock
Step: 3 Unlock
Document Format (1 attachment)
372-B-M-L-O-M (2900).docx
120 KBs Word File