

Question: In Exercises 7 and 8 of Chapter 4 you worked with data on sales for a line of skiwear that is produced by HeathCo Industries.
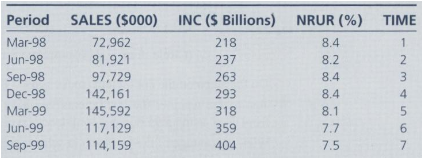
In Exercises 7 and 8 of Chapter 4 you worked with data on sales for a line of skiwear that is produced by HeathCo Industries. Barbara Lynch, product manager for the skiwear, has the responsibility of providing forecasts to top management of sales by quarter one year ahead. One of Ms. Lynch s colleagues. Dick Staples, suggested that unemployment and income in the regions in which the clothes are marketed might be causally connected to sales. If you worked the exercises in Chapter 4. you have developed three bivariate regression models of sales as a function of time (TIME), unemployment (NRUR), and income (INC). Data for these variables and for sales are as follows:
-1.png)
a. Now you can expand your analysis to see whether a multiple-regression model would work well. Estimate the following model:
SALES = b0 + b1 (INC) + b2 (NRUR)
SALES = ________ +/- ________ (INC) +/- ________ (NRUR)
(Circle + or €“ as appropriate for each variable)
Do the signs on the coefficients make sense? Explain why.
b. Test to see whether the coefficients you have estimated are statistically different from zero, using a 95 percent confidence level and a one-tailed test.
c. What percentage of the variation in sales is explained by this model?
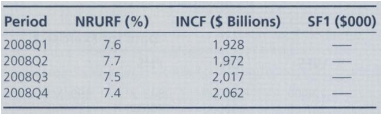
d. Use this model to make a sales forecast (SF1) for 2008Q1 through 2008Q4, given the previously forecast values for unemployment (NRURF) and income (INCF) as follows:
e. Actual sales for 2008 were: Ql = 334,271; Q2 = 328,982; Q3 = 317,921; Q4 = 350,118. On the basis of this information, how well would you say the model worked? What is the root-mean-squared error (RMSE)?
f. Plot the actual data for 2008Q1 through 2008Q4 along with the values predicted for each quarter based on this model, for 2008Q1 through 2008Q4.
89012345678901234567890123456789 29554323 766666666678888889001110988877777 5893 962752 125 99986 42723 5383 05222 5 7 44556 7 7778890 11222333456667 2 9 9 9 2 68477125 3385 11111111222121112222222222223332 1112 223333
Step by Step Solution
3.33 Rating (159 Votes )
There are 3 Steps involved in it
tr msoheightsourceauto col msowidthsourceauto br msodataplacementsamecell style0 msonumberformatGeneral textaligngeneral verticalalignbottom whitespacenowrap msorotate0 msobackgroundsourceauto msopatt... View full answer

Get step-by-step solutions from verified subject matter experts
Document Format (1 attachment)
647-M-S-L-R (6238).xlsx
300 KBs Excel File