Reconsider the portfolio selection example, including its spreadsheet model in Figure 8.13, given in Section 8.2. Note
Question:
For the sake of such an investor, add a constraint to the model that specifies that the percentage of Stock 3 in the portfolio cannot exceed the amount specified by the investor. Then compare the expected return and risk (standard deviation of the return) of the optimal portfolio with that in Figure 8.13 when the upper bound on the percentage of Stock 3 allowed in the portfolio is set at the following values.
a. 20%
b. 0%
c. Generate a parameter analysis report using RSPE to systematically try all the percentages at 5% intervals from 0% to 50%.
Expected Return
The expected return is the profit or loss an investor anticipates on an investment that has known or anticipated rates of return (RoR). It is calculated by multiplying potential outcomes by the chances of them occurring and then totaling these... Portfolio
A portfolio is a grouping of financial assets such as stocks, bonds, commodities, currencies and cash equivalents, as well as their fund counterparts, including mutual, exchange-traded and closed funds. A portfolio can also consist of non-publicly...
Fantastic news! We've Found the answer you've been seeking!
Step by Step Answer:
Related Book For 

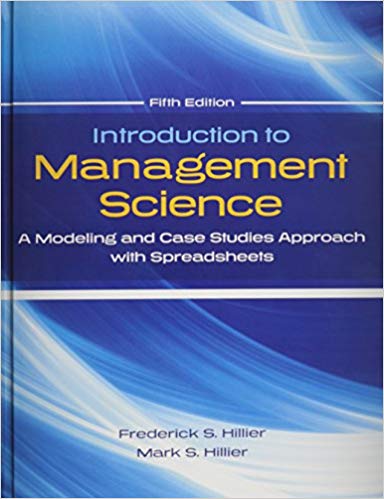
Introduction To Management Science A Modeling And Cases Studies Approach With Spreadsheets
ISBN: 1336
5th Edition
Authors: Frederick S. Hillier, Mark S. Hillier
Question Posted:


