Regression; choosing among models (chapter appendix) Tilbert Toys (TT) makes the popular Floppin Freddy Frog and Jumpin
Question:
Regression; choosing among models (chapter appendix) Tilbert Toys (TT) makes the popular Floppin’ Freddy Frog and Jumpin’ Jill Junebug dolls in batches. TT has recently adopted activity-based costing. TT incurs setup costs for each batch of dolls that it produces. TT uses “number of setups” as the cost driver for setup costs.
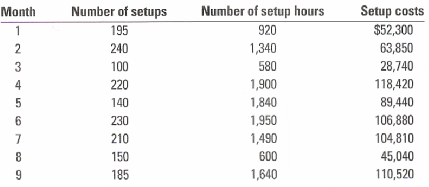
TT has just hired Bebe Williams, an accountant. Bebe thinks that “number of setup hours” might be a better cost driver because the setup time for each product is different. Bebe collects the following data.

1. Estimate the regression equation for (a) setup costs and number of setups and (b) setup costs and number of setup hours. You should obtain the following results:
Regression 1: Setup costs = a + (b × Number of setups)

Regression 2: Setup costs = a + (b × Number of setup-hours)

2. On two different graphs plot the data and the regression lines for each of the following cost functions.
a. Setup costs = a + (b × Number of setups)
b. Setup costs = a + (b × Number of setup hours)
3. Evaluate the regression models for “Number of setups” and “Number of setup-hours” as the cost driver according to the format of Exhibit 10-18.
4. Based on your analysis, which cost driver should Tilbert Toys use for setup costs, and why?
Step by Step Answer:

Cost Accounting A Managerial Emphasis
ISBN: 978-0136126638
13th Edition
Authors: Charles T. Horngren, Srikant M.Dater, George Foster, Madhav


