

Question: Sketch the pole-zero plot for each of the following z-transforms and shade the region of convergence: 1- ROC: [z < 2 (a) X1(z): 1+ 2z-1
Sketch the pole-zero plot for each of the following z-transforms and shade the region of convergence:
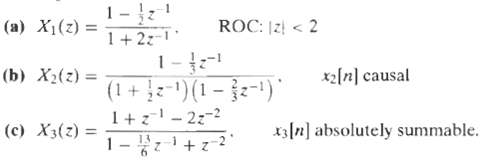
1- ROC: [z < 2 (a) X1(z): 1+ 2z-1 1- (b) X2(z) = x2[n] causal (1 + }2-)(1 }-1)" 1+z- 2z-2 1- +z2 (c) X3(z) = x3[n] absolutely summable. %3D
Step by Step Solution
★★★★★
3.36 Rating (171 Votes )
There are 3 Steps involved in it
1 Expert Approved Answer
Step: 1 Unlock

a The pole is at2 and the zero is at b The poles are at 12 and ... View full answer
Question Has Been Solved by an Expert!
Get step-by-step solutions from verified subject matter experts
Step: 2 Unlock
Step: 3 Unlock
Document Format (1 attachment)
30-E-T-E-D-S-P (102).docx
120 KBs Word File