

Question: Discuss the assumptions implicit in the two graphical models depicted in Figure 13.8. Suggest scenarios in which each model might apply. How would you determine
Discuss the assumptions implicit in the two graphical models depicted in Figure 13.8. Suggest scenarios in which each model might apply. How would you determine the
Figure 13.8
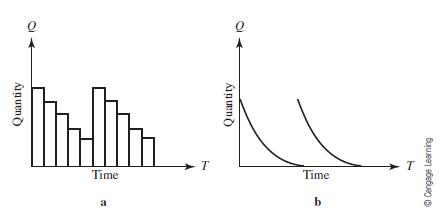
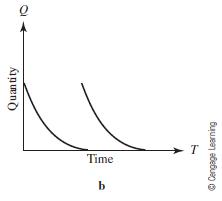
submodel for demand in Figure 13.8b? Discuss how you would compute the optimal order quantity in each case.
Figure 13.8 b
Quantity Time a T Quantity Time b Cengage Learning
Step by Step Solution
3.54 Rating (157 Votes )
There are 3 Steps involved in it
1 Assumptions in Each Model Figure 138a Stepwise Bar Graph Demand Pattern This graph shows demand that changes in discrete time intervals The quantity remains constant within each time period but may ... View full answer

Get step-by-step solutions from verified subject matter experts