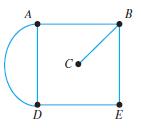
A connected graph is shown. For each graph, identify any (a) Bridges (b) Loops. A B Ce
Question:
A connected graph is shown. For each graph, identify any
(a) Bridges
(b) Loops.

Transcribed Image Text:
A B Ce D E
Fantastic news! We've Found the answer you've been seeking!
Step by Step Answer:
Answer rating: 85% (14 reviews)
a E...View the full answer

Answered By

Brown Arianne
Detail-oriented professional tutor with a solid 10 years of experience instilling confidence in high school and college students. Dedicated to empowering all students with constructive feedback and practical test-taking strategies. Effective educator and team player whether working in a school, university, or private provider setting. Active listener committed to helping students overcome academic challenges to reach personal goals.
4.60+
2+ Reviews
10+ Question Solved
Related Book For 

A Survey Of Mathematics With Applications
ISBN: 9780135740460
11th Edition
Authors: Allen R. Angel, Christine D. Abbott, Dennis Runde
Question Posted:
Students also viewed these Mathematics questions
-
A connected graph is shown. Identify any bridges in each graph. E
-
A connected graph is shown. Identify any bridges in each graph. D A
-
A connected graph is shown. Identify any bridges in each graph.
-
QUESTION 5 Directions: Passage B is the story of a childs first Halloweenparade. Read the passage carefully. Answer the questions thatfollow. Passage B I am six years old. It is Halloween. The school...
-
a. Hypothesise how the share price of JB Hi-Fi Ltd may have reacted to this announcement. What did happen to the share price around this time? b. Rationalise why an item such as the costs associated...
-
1 . An increase in merchandise inventory will reduce cash flow True False 2 . The purchase of a delivery truck will cause a decrease in cash from investing activities True False 3 . A decrease in...
-
9. Before taking a trip, do you look up driving directions or explore alternative routes? Answer each of the following questions with a Yes or No.
-
A process is in statistical control with x = 199 and R = 3.5. The control chart uses a sample size of n= 4. Specifications are at 200 ± 8. The quality characteristic is normally distributed....
-
A loan is being repaid with level payments of K each made every 6 months. The outstanding balances at three consecutive payment dates are 5;190:72, 5;084:68, and 4;973:66. Determine the payment...
-
"Part 1: The Performance Lawn Equipment database contains data needed to develop a pro forma income statement. Dealers selling PLE products all receive 18% of sales revenue for their part of doing...
-
A connected graph is shown. For each graph, identify any (a) Bridges (b) Loops. A B D. G H
-
Use Fleurys algorithm to determine an Euler circuit. There are many answers possible. A B C E IF G H.
-
A zookeeper has collected a male and a female lizard that look like they belong to the same species. They mate with each other and produce phenotypically normal offspring. However, the offspring are...
-
For this online discussion, we will explore the relevance of various management styles in the context of your respective organizations. Your task is to review different management styles and propose...
-
Is a t-Distribution Appropriate? A sample with size n = 10 has x = 508.5, and s = 21.5. The dotplot for this sample is given below. 0000 00 500 510 520 530 540 550 560 570 Indicate whether or not it...
-
Interpret the results. Write a statement to summarize your conclusion. Is a relationship present? Do we accept or reject the null hypothesis? Are the two variables related? Why or why not?
-
Case study information Australian Renewable Energy Hub Source: https://research.csiro.au/hyresource/australian-renewable-energy-hub/ April 20th, 2023 The Australian Renewable Energy Hub (AREH) will...
-
Listening is a crucial leadership skill that is essential for building effective relationships and solving problems. Write a paper that explores the importance of listening as a leadership skill,...
-
Fill in the blanks in the following table to answer the questions below. a. What is the optimal level of activity in the table above?b. What is the value of net benefit at the optimal level of...
-
In Exercises 1-2, rewrite each verbal statement as an equation. Then decide whether the statement is true or false. Justify your answer. 1. The logarithm of the difference of two numbers is equal to...
-
If the statement is true for all sets A and B, write true. If it is not true for all sets A and B, write false. Assume that A , U , and A U. A A
-
Construct a Venn diagram to determine whether the following statements are true for all sets A, B, and C. (A B') (A B) = A (B C)'
-
Use the Venn diagram in Fig. 2.24 to list the sets in roster form. (B © C)' 12 10 4 6 \14 6. 11 2 13
-
Prepare journal entries to record the following events: Jul. 1 Klemens Company accepted a 5%, 3-month, $8,000 note dated July 1 from Mox Company for the balance due on Mox's account. Jul. 31 Klemens...
-
FINANCIAL STATEMENT ANALYSIS INSTRUCTIONS 1. PREPARE RATIO ANALYSIS REPORT ( word file) Format 1. Introduction 2. Importance of Financial Statements 3. Importance of Financial statement analysis and...
-
Let us assume that Europe is in recession, China's economy is slowing down, and the US economy is growing at 1-2%. Use these assumptions to invest in 4 ETFs (electronically traded funds). The 4 ETFs...

Study smarter with the SolutionInn App


