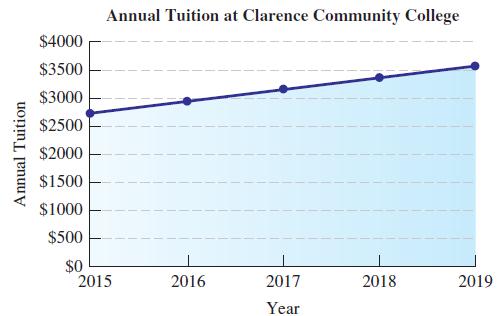
The graph below shows the annual tuition, to the nearest hundred dollars, at Clarence Community College for
Question:
The graph below shows the annual tuition, to the nearest hundred dollars, at Clarence Community College for the years 2015–2019.
a) Assuming this trend continues, use the graph to predict the annual tuition for the year 2020.
b) Explain how you are using inductive reasoning to determine your answer.
Fantastic news! We've Found the answer you've been seeking!
Step by Step Answer:
Related Book For 

A Survey Of Mathematics With Applications
ISBN: 9780135740460
11th Edition
Authors: Allen R. Angel, Christine D. Abbott, Dennis Runde
Question Posted:


