Question:
The MD&A for the 2019 City and County of Denver CAFR is included as Appendix B in this chapter. Following are two tables that have been adapted from the statistical section of the CAFR. Use the MD&A and the provided statistical tables to complete this case.
Required
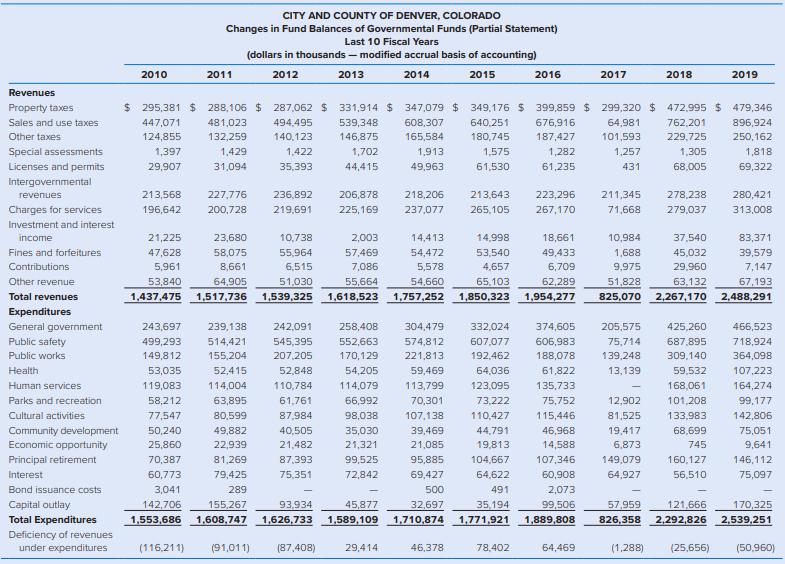
a. What are the three largest sources of governmental funds revenue? What percentage of the governmental funds revenue is from each of these sources?
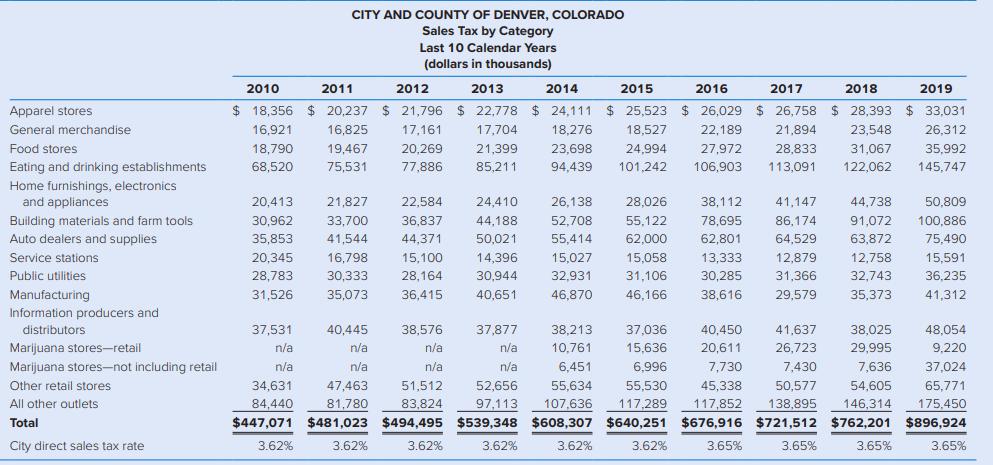
b. Sales tax is a large part of Denver’s tax revenue. Using information from the MD&A and trend information from both statistical tables provided, discuss trends in Denver’s sales tax revenues and your projection for sales tax revenues over the next two to three years.
c. What are the three largest sources of governmental funds expenditures? What percentage of the governmental funds expenditures does each of the three sources represent and what has been the trend for each over the past few years?
d. Compare the growth in revenue to the growth in expenditures over the past 10 years. Discuss any changes in the overall expenditure growth patterns you have seen and would expect to see over the next two to three years.


Transcribed Image Text:
Revenues
Property taxes
Sales and use taxes
Other taxes
Special assessments
Licenses and permits
Intergovernmental
revenues
Charges for services
Investment and interest
income
Fines and forfeitures
Contributions
Other revenue
Total revenues
Expenditures
General government
Public safety
Public works
Health
Human services
Parks and recreation
Cultural activities
Community development
Economic opportunity
Principal retirement
Interest
Bond issuance costs
Capital outlay
Total Expenditures
Deficiency of revenues
under expenditures
2010
$295,381
447,071
124,855
1,397
29,907
213,568
196,642
CITY AND COUNTY OF DENVER, COLORADO
Changes in Fund Balances of Governmental Funds (Partial Statement)
Last 10 Fiscal Years
(dollars in thousands-modified accrual basis of accounting)
2012
2013
2014
2015
2011
3,041
142,706
1,553,686
481,023
132,259
1,429
31,094
227,776
200,728
23,680
58,075
8,661
64,905
$ 288,106 $ 287,062 $ 331,914 $347,079 $ 349,176 $ 399,859 $ 299,320 $ 472.995 $479,346
762,201
229,725
494,495 539,348 608,307
140,123
146,875
165,584
1,702
1,913
44,415
49,963
1,422
35,393
236,892
219,691 225,169
10,738
55,964
6,515
51,030
243,697 239,138 242,091
499,293
514,421
545,395
149,812
155,204
207,205
53,035
52,415
119,083
114,004
58,212
63,895
77,547
80,599
50,240
49,882
25,860
22,939
70,387
81,269
60,773
79,425
289
52,848
110,784
61,761
87,984
40,505
21,482
206,878 218,206
237,077
87,393
75,351
21,225
2,003
47,628
57,469
7,086
5,961
53,840
1,437,475 1,517,736 1,539,325 1,618,523 1,757,252 1,850,323 1,954,277
55,664
(116,211) (91,011) (87,408)
258,408
552,663
170,129
54,205
114,079
66,992
98,038
35,030
21,321
99,525
72,842
155,267
93,934
45,877
1,608,747 1,626,733 1,589,109
14,413
54,472
29,414
5,578
54,660
304,479
574,812
221,813
59,469
113,799
70,301
107,138
640,251 676,916
180,745
1,575
187,427
1,282
61,235
61,530
213,643
265,105
46,378
14,998
53,540
4,657
65,103
332,024
607,077
192,462
64,036
2016
123,095
73,222
110,427
39,469
44,791
21,085
19,813
95,885
104,667
69,427
64,622
500
491
32,697 35,194
1,710,874 1,771,921
78,402
223,296
267,170
18,661
49,433
6,709
62,289
2017
64,469
64,981
101,593
1,257
431
211,345
278,238
71,668 279,037
374,605
606,983
188,078
61,822
135,733
75,752
115,446
46,968
14,588
107,346 149,079
60,908
64,927
2,073
99,506
1,889,808
205,575
75,714
139,248
13,139
2018
-
12,902
81,525
1,305
68,005
19,417
6,873
10,984
1,688
9,975
51,828
825,070 2,267,170 2,488,291
37,540
45,032
29,960
63,132
687,895
309,140
59,532
2019
168,061
101,208
133,983
68,699
745
896,924
250,162
160,127
56,510
1,818
69,322
425,260 466,523
718,924
364,098
280,421
313,008
83,371
39,579
7,147
67,193
107,223
164,274
99,177
142,806
75,051
9,641
146,112
75,097
121,666 170,325
57,959
826,358 2,292,826 2,539,251
(1,288) (25,656) (50,960)


